
A pie chart (or a circle chart) is a circular statistical graphic which is divided into slices to illustrate numerical proportion. In a pie chart, the...
22 KB (2,340 words) - 01:45, 6 May 2025

represented by symbols, such as bars in a bar chart, lines in a line chart, or slices in a pie chart". A chart can represent tabular numeric data, functions...
13 KB (1,513 words) - 22:21, 24 May 2025
"American Pie" is a song by American singer and songwriter Don McLean. Recorded and released in 1971 on the album of the same name, the single was the...
98 KB (8,299 words) - 12:33, 2 June 2025

Misleading graph (redirect from Bad chart)
display the data of interest is discouraged for charts in general, not only for pie charts. In a 3D pie chart, the slices that are closer to the reader appear...
38 KB (4,098 words) - 02:13, 8 June 2025
on the US Billboard 200 album chart, and hit number 20 in the UK and number 9 in Australia. The album was Humble Pie's first following the departure of...
8 KB (730 words) - 00:30, 19 May 2025

Treemapping (redirect from Rectangular pie chart)
York. Disk space analyzer Data and information visualization Marimekko Chart, a similar concept with one level of explicit hierarchy. Li, Rita Yi Man;...
22 KB (2,184 words) - 15:36, 8 March 2025
reached number one on the Billboard 200, containing the chart-topping singles "American Pie" and "Vincent". Recorded in May and June 1971 at The Record...
16 KB (1,416 words) - 04:37, 4 June 2025
Univariate (statistics) (section Pie charts)
with the frequency of values assigned to a value range called a bin. Pie chart is a circle divided into portions that represent the relative frequencies...
12 KB (1,513 words) - 16:24, 14 June 2024
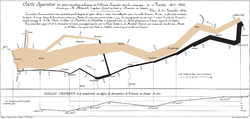
William Playfair (category Statistical charts and diagrams)
introduced the line, area and bar chart of economic data, and in 1801 he published what were likely the first pie chart and circle graph, used to show part-whole...
29 KB (3,369 words) - 16:46, 3 June 2025
"Sweetest Pie" is a song by American rapper Megan Thee Stallion and English and Albanian singer Dua Lipa, released on March 11, 2022, through 1501 Certified...
33 KB (2,222 words) - 02:40, 20 January 2025

A bar chart or bar graph is a chart or graph that presents categorical data with rectangular bars with heights or lengths proportional to the values that...
11 KB (1,307 words) - 22:47, 29 May 2025
Looker Studio (section Pie charts)
table, Scorecard, Gauge, Time series, Line, Area, Scatter, Bar, Pie, Google Maps, Geo chart, Bullet, and Treemap. After choosing the visualization method...
17 KB (1,858 words) - 03:26, 19 March 2025

Humble Pie are an English rock band formed by Steve Marriott and Peter Frampton in Moreton, Essex, in 1969. They are known as one of the first supergroups...
36 KB (3,645 words) - 06:57, 24 May 2025

Religion in Brazil (section Pie Chart notes)
Religion in Brazil (2022 census) Catholicism (56.75%) Protestantism (26.85%) Spiritism (1.84%) Afro-Brazilian religions (1.05%) Other religions (4.07%)...
55 KB (5,320 words) - 03:31, 9 June 2025
Canada. Retrieved 20 September 2024. "Humble Pie Chart History (Billboard 200)". Billboard. Retrieved 20 September 2024. Humble Pie history and biographies...
7 KB (721 words) - 22:36, 28 May 2025

Lahan (section Ethnic/Caste Composition Pie Chart)
Lahan (लहान) is a city and municipality in the Siraha district of Madhesh, Nepal. Lahan is the 36th densest municipality in the country, with a population...
10 KB (872 words) - 03:38, 26 May 2025
BBC Schools (section The Pie Chart)
black and white card with a pie chart split into five segments with a BBC logo in the bottom right corner. The pie chart segments disappeared with the...
16 KB (2,032 words) - 15:56, 30 May 2025
February 2021. "Warrant – Cherry Pie". Top 40 Singles. Retrieved 14 August 2021. "Official Singles Chart Top 100". Official Charts Company. Retrieved 20 September...
11 KB (1,066 words) - 07:32, 28 January 2025

Scatter plot (redirect from Scatter chart)
A scatter plot, also called a scatterplot, scatter graph, scatter chart, scattergram, or scatter diagram, is a type of plot or mathematical diagram using...
12 KB (1,328 words) - 00:24, 26 May 2025
Mainstream Rock Tracks chart and #36 on the Australian charts and spawning two music videos. Prior to the writing of the song "Cherry Pie", the album's title...
18 KB (1,565 words) - 19:44, 30 April 2025

design, a pie menu or radial menu is a circular context menu where selection depends on direction. It is a graphical control element. A pie menu is made...
21 KB (1,982 words) - 14:45, 8 April 2025

chart is also known as web chart, spider chart, spider graph, spider web chart, star chart, star plot, cobweb chart, irregular polygon, polar chart,...
20 KB (2,497 words) - 06:58, 5 March 2025
proportion of time that each behaviour occupies can be represented in a pie chart or bar chart. Ethograms are used extensively in the study of welfare science...
8 KB (861 words) - 14:50, 8 May 2025

graphs, bar charts, line graphs, area charts, and histograms. In his work, Statistical Breviary, he is credited with introducing the first pie chart. Around...
40 KB (4,817 words) - 03:25, 20 May 2025
be used with frequency distributions are histograms, line charts, bar charts and pie charts. Frequency distributions are used for both qualitative and...
13 KB (1,590 words) - 21:01, 12 May 2025
Data and information visualization (category Statistical charts and diagrams)
visualization include charts and graphs (e.g. pie charts, bar charts, line charts, area charts, cone charts, pyramid charts, donut charts, histograms, spectrograms...
89 KB (8,241 words) - 08:17, 20 May 2025
List of graphical methods (category Statistical charts and diagrams)
chart Bar chart Histogram Variable-width bar chart Box plot Dispersion fan diagram Graph of a function Logarithmic graph paper Heatmap Line chart Pie...
4 KB (335 words) - 04:31, 6 November 2024
spreadsheets, and pie charts. After Mac states that it's difficult to capture a family vacation using a pie chart, PC rebuts by showing a pie chart representing...
64 KB (9,576 words) - 02:35, 8 June 2025
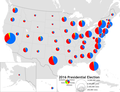
Proportional symbol map (section Chart maps)
proportional circle sized according to some total amount, and turn it into a pie chart to visualize the relative composition of the total, such as the percentage...
29 KB (3,735 words) - 07:34, 25 May 2025
Eat It (album) (redirect from Eat It (Humble Pie album))
September 2024. "Official Albums Chart Top 100". Official Charts Company. Retrieved 20 September 2024. "Humble Pie Chart History (Billboard 200)". Billboard...
7 KB (693 words) - 00:31, 27 September 2024