
In oceanography, temperature-salinity diagrams, sometimes called T-S diagrams, are used to identify water masses. In a T-S diagram, rather than plotting...
3 KB (326 words) - 16:50, 18 September 2024
Water mass (section Temperature and salinity diagram)
also in turn causes the salinity of the water to decrease. The salinity of the water makes water freeze at lower temperatures than freshwater. Freshwater...
5 KB (566 words) - 12:15, 21 February 2024
A T-S diagram may refer to: a temperature salinity diagram; a temperature-entropy diagram; a Tanabe–Sugano diagram. This disambiguation page lists articles...
196 bytes (52 words) - 16:32, 12 December 2018
water due to salinity, and can be below −2 °C, depending on salinity and pressure. These density differences caused by temperature and salinity ultimately...
25 KB (4,885 words) - 14:01, 11 July 2025

Ocean (redirect from Ocean salinity)
surface salinity between 1950 and 2019 indicate that regions of high salinity and evaporation have become more saline while regions of low salinity and more...
129 KB (17,496 words) - 01:20, 15 July 2025

sodium chloride). On the United States Geological Survey (USGS) salinity scale, saline water is saltier than brackish water, but less salty than brine...
6 KB (584 words) - 13:44, 10 April 2025

S2CID 250746507. Yang, C. C.; Li, S. (2008). "Size-Dependent Temperature-Pressure Phase Diagram of Carbon". Journal of Physical Chemistry C. 112 (5): 1423–1426...
45 KB (1,319 words) - 15:03, 30 June 2025
symbol τ, is a term in oceanography referring to variations in the temperature and salinity of seawater over space or time, whose combined effects leave the...
9 KB (1,195 words) - 13:29, 12 July 2025

but they have different properties; for instance, different salinities and temperatures. Seawater almost always gets denser if it gets either slightly...
6 KB (722 words) - 14:37, 23 May 2025

Surface tension (section Influence of temperature)
the salinity range of 20 ≤ S ≤ 131 g/kg and a temperature range of 1 ≤ t ≤ 92 °C at atmospheric pressure. The range of temperature and salinity encompasses...
72 KB (8,828 words) - 14:30, 18 June 2025
Supercritical fluid (section Phase diagram)
and 2 show two-dimensional projections of a phase diagram. In the pressure-temperature phase diagram (Fig. 1) the boiling curve separates the gas and liquid...
44 KB (4,876 words) - 22:42, 10 July 2025
desalinated water quality from the low temperature distillation process is almost demineralized water with a remaining salinity of 10 ppm. Residual contaminants...
25 KB (3,382 words) - 21:29, 11 July 2025

for researching the ocean. It uses profiling floats to observe temperature, salinity and currents. Recently it has observed bio-optical properties in...
24 KB (2,850 words) - 15:06, 30 June 2025

levels of salinity are about 30–35‰, but due to predators at these salt levels, brine shrimp seldom occur in natural habitats at salinities of less than...
29 KB (3,164 words) - 00:59, 4 July 2025

calculate the Gouy–Chapmanm potential, the salinity factor must be calculated. The expression given for the salinity factor is as follows: κ = Σ ( z ∗ e )...
34 KB (3,601 words) - 11:27, 29 June 2024
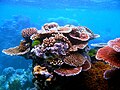
grazing by herbivores such as parrotfish. Water temperature changes of more than 1–2 °C (1.8–3.6 °F) or salinity changes can kill some species of coral. Under...
111 KB (12,428 words) - 03:28, 15 July 2025

specific ethanol concentration. The temperatures and mixing ratios of these phase equilibria can be read from the phase diagram of ethanol and water. The maximum...
8 KB (962 words) - 12:59, 16 April 2025
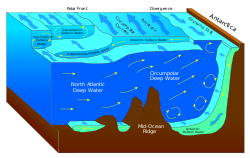
the northern flank of the Antarctic Circumpolar Current Temperature–salinity diagram – Diagrams used to identify water masses Weddell Sea Bottom Water...
226 KB (32,627 words) - 03:02, 13 July 2025

naturally forms a vertical salinity gradient also known as a "halocline", in which low-salinity water floats on top of high-salinity water. The layers of salt...
7 KB (927 words) - 17:45, 29 May 2025
the water column change with depth: pressure increases; temperature and light decrease; salinity, oxygen, micronutrients (such as iron, magnesium and calcium)...
14 KB (1,448 words) - 01:55, 15 July 2025

miscibility gap in their temperature-composition diagram. Depending on whether the miscibility gap is found at high or low temperatures, either an upper critical...
59 KB (6,025 words) - 22:05, 14 July 2025
Microemulsion (section Phase diagrams)
parameters may have an assumed or measured pressure and/or temperature dependence (and/or the salinity of the aqueous phase), which may be used to infer the...
11 KB (1,519 words) - 13:07, 30 April 2025
of a single material, so that this is a good model. (See the adjacent diagram.) When this is the case, the resistance of the conductor is directly proportional...
78 KB (8,181 words) - 17:20, 24 May 2025
(1–100 GHz) in atmospheric windows to observe sea-surface salinity, soil moisture, sea-surface temperature, wind speed over ocean, precipitation and snow. Other...
20 KB (2,395 words) - 00:17, 20 June 2025
diagram. Limit imposed by phase diagram. Upper limit imposed by phase diagram. Limit imposed by phase diagram. Lower limit imposed by phase diagram....
58 KB (3,932 words) - 01:17, 25 May 2025
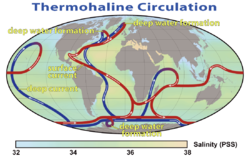
where the TS lines of the other water masses converge. TS diagrams refer to temperature and salinity profiles, which are one of the major ways water masses...
6 KB (640 words) - 17:33, 23 May 2025

Groundwater (section Temperature)
the widespread presence of contaminants such as arsenic, fluoride and salinity can reduce the suitability of groundwater as a drinking water source. Arsenic...
63 KB (8,037 words) - 00:25, 23 May 2025

living here must be able to withstand the varying conditions of temperature, light, and salinity. Despite this, productivity is high in this zone. The wave...
17 KB (2,187 words) - 02:46, 25 May 2025

(molt increment). Salinity and disease also have subtle impacts on molting and growth rate. Molting occurs more rapidly in low-salinity environments. The...
48 KB (4,913 words) - 14:20, 8 July 2025