
A time–distance diagram is generally a diagram with one axis representing time and the other axis distance. Such charts are used in the aviation industry...
13 KB (1,552 words) - 19:17, 26 March 2022

spacetime diagram, referred to as the object's world line. Each point in a spacetime diagram represents a unique position in space and time and is referred...
49 KB (6,178 words) - 14:42, 23 March 2025
Function graph Scatter plot Hanger diagram. Schematics and other types of diagrams, for example: Time–distance diagram Exploded view Population density...
16 KB (1,045 words) - 06:35, 5 March 2025
Linear scheduling method (redirect from Time versus distance diagram)
construction Linear scheduling Time versus distance diagrams (T-D charts) Time chainage Linear balance charts Velocity diagrams List of project management...
3 KB (273 words) - 05:24, 26 September 2024

In mathematics, a Voronoi diagram is a partition of a plane into regions close to each of a given set of objects. It can be classified also as a tessellation...
46 KB (5,504 words) - 02:43, 25 March 2025

A constellation diagram is a representation of a signal modulated by a digital modulation scheme such as quadrature amplitude modulation or phase-shift...
7 KB (983 words) - 05:56, 6 March 2025

between objects. Comoving distance factors out the expansion of the universe, giving a distance that does not change in time except due to local factors...
18 KB (2,437 words) - 08:05, 22 April 2025

The Hertzsprung–Russell diagram (abbreviated as H–R diagram, HR diagram or HRD) is a scatter plot of stars showing the relationship between the stars'...
23 KB (2,762 words) - 22:46, 23 April 2025
the power distance to C is smaller than the power distance to the other circles. The power diagram is a form of generalized Voronoi diagram, and coincides...
11 KB (1,210 words) - 03:06, 8 October 2024
Timing diagram may refer to: Digital timing diagram Timing diagram (Unified Modeling Language) Time–distance diagram This disambiguation page lists articles...
358 bytes (48 words) - 23:31, 7 December 2021

solar differential rotation profile, a travel-time deviation map for sunspots, and a time–distance diagram from quiet-Sun measurements Used in Invariant...
56 KB (8,848 words) - 15:24, 16 May 2025
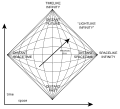
general relativity) of the Minkowski diagram of special relativity where the vertical dimension represents time, and the horizontal dimension represents...
10 KB (1,198 words) - 22:31, 12 April 2025

In theoretical physics, a Feynman diagram is a pictorial representation of the mathematical expressions describing the behavior and interaction of subatomic...
93 KB (15,967 words) - 06:48, 22 March 2025
Spatiotemporal database Time–distance diagram Tobler's first law of geography Tobler's second law of geography Value of time Thrift & Pred 1981, p. 277;...
39 KB (4,023 words) - 14:09, 20 October 2024
Spacetime (redirect from Space-time distance)
dimension of time into a single four-dimensional continuum. Spacetime diagrams are useful in visualizing and understanding relativistic effects, such...
132 KB (19,765 words) - 15:06, 10 May 2025
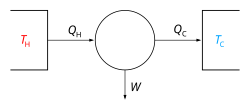
Thermodynamic diagrams are diagrams used to represent the thermodynamic states of a material (typically fluid) and the consequences of manipulating this...
9 KB (1,237 words) - 21:41, 3 April 2025

Mathematical diagrams, such as charts and graphs, are mainly designed to convey mathematical relationships—for example, comparisons over time. A complex...
13 KB (1,582 words) - 06:43, 5 March 2025
A pressure–volume diagram (or PV diagram, or volume–pressure loop) is used to describe corresponding changes in volume and pressure in a system. It is...
10 KB (1,168 words) - 01:50, 4 May 2025
Principle of locality (section Action at a distance)
is repeated many times and the results are compared. A spacetime diagram has a time coordinate going vertical and a space coordinate going horizontal...
23 KB (2,821 words) - 00:44, 3 May 2025
calculating the Fréchet distance of two curves is the free-space diagram, which was introduced by Alt and Godau. The free-space diagram between two curves...
16 KB (1,894 words) - 14:04, 31 March 2025
of track. Ibry developed a time–distance diagram and ruler to determine train plans and keep trains apart. It shows distance (with train stations) on the...
6 KB (400 words) - 21:52, 17 January 2025

Parallax in astronomy (category Length, distance, or range measuring devices)
p in the diagram when scaled-down and modified as mentioned above. The lunar horizontal parallax at any time depends on the linear distance of the Moon...
35 KB (5,048 words) - 03:54, 31 January 2025

The fundamental diagram of traffic flow is a diagram that gives a relation between road traffic flux (vehicles/hour) and the traffic density (vehicles/km)...
10 KB (1,523 words) - 09:22, 28 June 2023

figure below. Note we use conformal time in the following diagrams. Conformal time describes the amount of time it would take a photon to travel from...
13 KB (1,813 words) - 22:50, 5 February 2025

is an extension of the Voronoi diagram that outputs a real value at a given coordinate that corresponds to the distance of the nth nearest seed (usually...
4 KB (424 words) - 03:22, 15 May 2025
the distance δ and time τ. The spacing between vehicles at traffic state A can be found using a geometric relationship found in the time-space diagram: sA...
4 KB (495 words) - 14:45, 3 March 2024

Pie chart (redirect from Polar area diagram)
comparisons on one diagram, as is seen in the polar area diagram famously developed by Florence Nightingale. The first known use of polar area diagrams was by André-Michel...
22 KB (2,340 words) - 01:45, 6 May 2025

Genetic distance is a measure of the genetic divergence between species or between populations within a species, whether the distance measures time from...
39 KB (4,746 words) - 11:17, 3 May 2025

at the diagram, each angle of elevation or PPI has data at height X at a certain distance from the radar. Using the data at the right distance, one forms...
4 KB (549 words) - 05:10, 9 December 2023

(analēmma) 'support') is a diagram showing the position of the Sun in the sky as seen from a fixed location on Earth at the same mean solar time over the course...
38 KB (4,957 words) - 15:50, 15 May 2025