A diagram is a symbolic representation of information using visualization techniques. Diagrams have been used since prehistoric times on walls of caves...
16 KB (1,045 words) - 06:35, 5 March 2025

diagram is a widely used diagram style that shows the logical relation between sets, popularized by John Venn (1834–1923) in the 1880s. The diagrams are...
31 KB (3,242 words) - 13:31, 22 April 2025

The Hertzsprung–Russell diagram (abbreviated as H–R diagram, HR diagram or HRD) is a scatter plot of stars showing the relationship between the stars'...
23 KB (2,762 words) - 22:46, 23 April 2025

In theoretical physics, a Feynman diagram is a pictorial representation of the mathematical expressions describing the behavior and interaction of subatomic...
93 KB (15,967 words) - 06:48, 22 March 2025

another set diagramming technique, Venn diagrams. Unlike Venn diagrams, which show all possible relations between different sets, the Euler diagram shows only...
37 KB (3,634 words) - 02:03, 28 March 2025

In mathematics, a Voronoi diagram is a partition of a plane into regions close to each of a given set of objects. It can be classified also as a tessellation...
46 KB (5,504 words) - 02:43, 25 March 2025
Syntax diagrams (or railroad diagrams) are a way to represent a context-free grammar. They represent a graphical alternative to Backus–Naur form, EBNF...
5 KB (541 words) - 19:04, 15 May 2025

Ishikawa diagrams (also called fishbone diagrams, herringbone diagrams, cause-and-effect diagrams) are causal diagrams created by Kaoru Ishikawa that...
10 KB (1,201 words) - 13:14, 28 April 2025
A Cluster diagram or clustering diagram is a general type of diagram, which represents some kind of cluster. A cluster in general is a group or bunch of...
6 KB (596 words) - 06:18, 11 August 2024

spacetime diagram is a graphical illustration of locations in space at various times, especially in the special theory of relativity. Spacetime diagrams can...
49 KB (6,178 words) - 14:42, 23 March 2025

Sankey diagrams are a data visualisation technique or flow diagram that emphasizes flow/movement/change from one state to another or one time to another...
7 KB (730 words) - 05:23, 5 May 2025

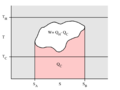
A phase diagram in physical chemistry, engineering, mineralogy, and materials science is a type of chart used to show conditions (pressure, temperature...
22 KB (2,517 words) - 20:50, 4 March 2025
In thermodynamics, a temperature–entropy (T–s) diagram is a thermodynamic diagram used to visualize changes to temperature (T ) and specific entropy (s)...
3 KB (163 words) - 02:10, 8 January 2023

In mathematics, particularly in dynamical systems, a bifurcation diagram shows the values visited or approached asymptotically (fixed points, periodic...
6 KB (594 words) - 04:59, 26 April 2025

In software engineering, a sequence diagram shows process interactions arranged in time sequence. This diagram depicts the processes and objects involved...
7 KB (909 words) - 07:29, 5 March 2025

/ / and ⟨ ⟩, see IPA § Brackets and transcription delimiters. A vowel diagram or vowel chart is a schematic arrangement of the vowels. Depending on the...
7 KB (898 words) - 07:26, 5 March 2025

A block diagram is a diagram of a system in which the principal parts or functions are represented by blocks connected by lines that show the relationships...
6 KB (742 words) - 16:11, 22 October 2023

in solution chemistry, a Pourbaix diagram, also known as a potential/pH diagram, EH–pH diagram or a pE/pH diagram, is a plot of possible thermodynamically...
28 KB (4,311 words) - 18:47, 21 April 2025

In software engineering, a class diagram in the Unified Modeling Language (UML) is a type of static structure diagram that describes the structure of a...
19 KB (2,099 words) - 07:40, 5 March 2025
A sentence diagram is a pictorial representation of the grammatical structure of a sentence. The term "sentence diagram" is used more when teaching written...
9 KB (1,047 words) - 20:52, 15 March 2025

A QAPF diagram is a doubled-triangle plot diagram used to classify igneous rocks based on their mineralogy. The acronym QAPF stands for "quartz, alkali...
7 KB (856 words) - 01:07, 28 April 2025

A circuit diagram (or: wiring diagram, electrical diagram, elementary diagram, electronic schematic) is a graphical representation of an electrical circuit...
12 KB (1,307 words) - 11:08, 20 January 2024

In molecular spectroscopy, a Jablonski diagram is a diagram that illustrates the electronic states and often the vibrational levels of a molecule, and...
4 KB (457 words) - 12:26, 6 April 2025

In solid-state physics of semiconductors, a band diagram is a diagram plotting various key electron energy levels (Fermi level and nearby energy band edges)...
10 KB (1,365 words) - 00:19, 17 March 2025

especially in category theory, a commutative diagram is a diagram such that all directed paths in the diagram with the same start and endpoints lead to the...
9 KB (1,123 words) - 10:21, 23 April 2025

A constellation diagram is a representation of a signal modulated by a digital modulation scheme such as quadrature amplitude modulation or phase-shift...
7 KB (983 words) - 05:56, 6 March 2025

In physics and engineering, a free body diagram (FBD; also called a force diagram) is a graphical illustration used to visualize the applied forces, moments...
16 KB (2,248 words) - 05:13, 24 April 2025

A Wiggers diagram, named after its developer, Carl Wiggers, is a unique diagram that has been used in teaching cardiac physiology for more than a century...
4 KB (298 words) - 14:33, 6 December 2023
A data-flow diagram is a way of representing a flow of data through a process or a system (usually an information system). The DFD also provides information...
13 KB (1,790 words) - 07:11, 31 March 2025

A wiring diagram is a simplified conventional pictorial representation of an electrical circuit. It shows the components of the circuit as simplified...
4 KB (458 words) - 02:27, 21 August 2024