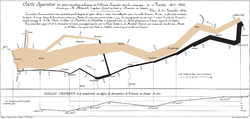
focuses on how analytical reasoning can be facilitated by interactive visual interfaces. Visual analytics is "the science of analytical reasoning facilitated...
17 KB (2,105 words) - 12:58, 15 July 2025
descriptive analytics, diagnostic analytics, predictive analytics, prescriptive analytics, and cognitive analytics. Analytics may apply to a variety of fields...
35 KB (3,482 words) - 16:23, 23 May 2025
Visualization (graphics) (redirect from Visual representation)
usability. Visual analytics focuses on human interaction with visualization systems as part of a larger process of data analysis. Visual analytics has been...
27 KB (3,072 words) - 15:32, 27 June 2025
description, while business analytics focusses on prediction and prescription. Business analytics makes extensive use of analytical modeling and numerical...
9 KB (980 words) - 11:22, 31 May 2025
2020. Cultural analytics shares many ideas and approaches with visual analytics ("the science of analytical reasoning facilitated by visual interactive interfaces")...
7 KB (829 words) - 18:32, 18 March 2025
Agenda for Visual Analytics National Visualization and Analytics Center. Keim D A, Mansmann F, Schneidewind J, Thomas J, Ziegler H: Visual analytics: Scope...
8 KB (815 words) - 04:45, 9 July 2025
and Visual Analytics", which is defined as the science of analytical reasoning facilitated by interactive visual interfaces. Data and Visual Analytics requires...
9 KB (1,023 words) - 20:37, 21 January 2025
provides innovative new opportunities for LCE: Visual analytics (VA) integrates visualization and data analytics to process large, dynamic data sets and solve...
14 KB (1,668 words) - 11:35, 24 May 2025
Nicola (2015). "Approximated and User Steerable tSNE for Progressive Visual Analytics". arXiv:1512.01655 [cs.CV]. Schubert, Erich; Gertz, Michael (2017-10-04)...
15 KB (2,065 words) - 01:25, 24 May 2025
Path: The R&D Agenda for Visual Analytics Archived 2008-09-29 at the Wayback Machine. National Visualization and Analytics Center. p.30 "Stephen Few-Perceptual...
82 KB (7,723 words) - 07:12, 11 July 2025
components. Visual analytics describes the discipline of interactive visual analysis of data, also described as “the science of analytical reasoning supported...
8 KB (1,031 words) - 00:48, 15 May 2025
Turkay, Cagatay; Wrobel, Stefan (2020), "Visual Analytics for Investigating and Processing Data", Visual Analytics for Data Scientists, Cham: Springer International...
10 KB (759 words) - 00:49, 20 June 2025
Guided analytics is a sub-field at the interface of visual analytics and predictive analytics focused on the development of interactive visual interfaces...
6 KB (634 words) - 00:43, 6 June 2025
company based in Marina Del Rey, California. It specializes in providing visual analytics and performance data to competitive gamers, aimed at improving gaming...
6 KB (512 words) - 03:35, 27 November 2024
model systems, and have a long history in learning, brainstorming, memory, visual thinking, and problem solving by educators, engineers, psychologists, and...
15 KB (1,793 words) - 16:44, 29 May 2025
the Windows operating system. The software is focused on exploratory visual analytics, where users investigate and explore data. It also supports the verification...
31 KB (2,966 words) - 19:05, 29 June 2025
Amal; George, Kelly (eds.), "Introduction to Analytics and Data Science", Harnessing the Power of Analytics, Cham: Springer International Publishing, pp...
13 KB (1,082 words) - 19:45, 17 June 2025
Engineers (IEEE) in 2015 for his contributions to pattern recognition and visual analytics. He was awarded an Australian Laureate Fellowship in 2017. In 2018...
4 KB (305 words) - 22:49, 6 May 2025
and analytics center for the United States Department of Homeland Security, focused on problems in information visualization and visual analytics. In...
13 KB (1,129 words) - 18:51, 27 April 2025
visualization and visual analytics at the University of Cologne. Her research concerns information visualization, graph drawing, and visual analytics. Von Landesberger...
5 KB (394 words) - 20:38, 21 January 2025
'The Anchoring Effect in Decision-Making with Visual Analytics', 2017 IEEE Conference on Visual Analytics Science and Technology, VAST 2017 - Proceedings...
54 KB (5,696 words) - 22:28, 11 July 2025
analytics), Geographic analytics additionally focuses on making business decisions based on the data visualization on the map (prescriptive analytics)...
6 KB (736 words) - 20:31, 25 April 2024
incorporate data-driven analytics and visual analytics tools. For instance, the Decision Exploration Lab introduced visual analytics solutions to help understand...
10 KB (1,041 words) - 02:55, 25 May 2025
Path: The R&D Agenda for Visual Analytics Archived 2008-09-29 at the Wayback Machine. National Visualization and Analytics Center. p.30 Lawrence J. Rosenblum...
27 KB (3,063 words) - 18:44, 5 July 2025
visualization". Information visualization reference model Prefuse Visual analytics Interactive visual analysis Books: 1999. Readings in Information Visualization:...
9 KB (862 words) - 20:37, 21 January 2025
Morphological analysis Ontology (information science) Schema (psychology) Visual analytics Visual language Node–link approaches Argument map Cladistics Cognitive...
8 KB (813 words) - 23:32, 23 May 2025
known for his extensive research in information visualization and visual analytics, including his earlier work in software visualization and algorithm...
11 KB (1,087 words) - 20:37, 21 January 2025
Spotfire 11 in 2020 featured Hyperconverged Analytics, which has been described as "the confluence of visual analytics, data science and streaming data capture...
9 KB (777 words) - 00:17, 17 February 2025
GUI – GUI interface for R Revolution Analytics – production-grade software for the enterprise big data analytics RStudio – GUI interface and development...
14 KB (1,449 words) - 20:02, 21 June 2025
Visual Analytics for Sense-making in Criminal Intelligence Analysis (VALCRI) is a software tool that helps investigators to find related or relevant information...
8 KB (807 words) - 10:43, 28 May 2025


