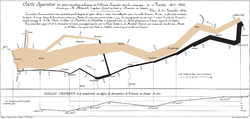
is a list of graphical methods with a mathematical basis. Included are diagram techniques, chart techniques, plot techniques, and other forms of visualization...
4 KB (335 words) - 04:31, 6 November 2024
input methods are easier to learn but are less efficient, while graphical methods allow faster input, but have a steep learning curve. Other methods allow...
14 KB (1,539 words) - 01:41, 16 April 2025

Data flow diagram Information flow diagram Event partitioning List of graphical methods Network diagram Requirements analysis Software development process...
8 KB (959 words) - 20:47, 9 March 2025

A graphical user interface, or GUI, is a form of user interface that allows users to interact with electronic devices through graphical icons and visual...
36 KB (3,770 words) - 12:32, 24 May 2025
All pages with titles beginning with Visual Graphics List of graphical methods, various forms of visualization Guided imagery, a mind-body intervention...
1 KB (181 words) - 20:34, 8 July 2023
This is a list of mathematics-based methods. Adams' method (differential equations) Akra–Bazzi method (asymptotic analysis) Bisection method (root finding)...
3 KB (238 words) - 18:31, 29 August 2024
Value-stream mapping Workflow List of graphical methods Bruza, P. D.; van der Weide, Th. P. (1990-11-01). "Assessing the quality of hypertext views". ACM SIGIR...
13 KB (1,790 words) - 20:12, 5 June 2025
systems. List of knapsack problems List of network theory topics List of graphical methods List of mathematics-based methods List of rules of inference...
21 KB (2,589 words) - 20:36, 29 May 2025
distributions List of graphical methods List of fields of application of statistics List of stochastic processes topics Lists of statistics topics List of statistical...
87 KB (8,280 words) - 23:04, 12 March 2025
Diagram (section Gallery of diagram types)
diagrams and other data visualization List of graphical methods Mathematical diagram – Visual representation of a mathematical relationship PGF/TikZ –...
16 KB (1,045 words) - 06:35, 5 March 2025
Glossary of probability and statistics Index of statistics articles List of fields of application of statistics List of graphical methods Lists of statistics...
9 KB (753 words) - 12:06, 11 April 2024
Statistical graphics (redirect from Statistics graphical technique)
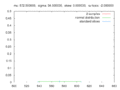
present in the data to others. Graphical statistical methods have four objectives: The exploration of the content of a data set The use to find structure...
7 KB (708 words) - 05:29, 5 May 2025
Data and information visualization (redirect from Graphical tools)
graphical data analysis Infographics Information design Information management List of graphical methods List of information graphics software List of...
89 KB (8,242 words) - 02:55, 20 June 2025
linear relationships. List of graphical methods Included are diagram techniques, chart techniques, plot techniques, and other forms of visualization. Local...
71 KB (7,692 words) - 22:32, 2 March 2025

Note-taking (section Electronic note-taking methods)
recognition List of graphical methods Memorandum Sketchnoting Makany, Tamas; Kemp, Jonathan; Dror, Itiel E. (2009). "Optimising the use of note-taking as an...
28 KB (3,250 words) - 20:01, 9 June 2025
analyses of categorical data List of fields of application of statistics List of graphical methods List of statistical software Comparison of statistical...
2 KB (179 words) - 04:09, 18 April 2022
The Graphical Path Method (GPM) is a mathematically based algorithm used in project management for planning, scheduling and resource control. GPM represents...
7 KB (887 words) - 21:07, 30 October 2021
A graphical model or probabilistic graphical model (PGM) or structured probabilistic model is a probabilistic model for which a graph expresses the conditional...
11 KB (1,278 words) - 04:58, 15 April 2025

needed] Category:Diagramming software Comparison of numerical-analysis software List of graphical methods PGF/TikZ – Graphics languages "The Dap Project...
23 KB (225 words) - 13:32, 15 April 2025

Japanese input methods are used to input Japanese characters on a computer. There are two main methods of inputting Japanese on computers. One is via a...
17 KB (2,129 words) - 16:20, 18 June 2025

Plot (graphics) (category CS1 maint: multiple names: authors list)
of specified type. Chart Diagram Graph of a function Line chart List of charting software List of graphical methods Plotting software Plotter List of...
20 KB (2,604 words) - 07:11, 18 March 2025
the use of computational and graphical methods in statistics and data analysis, including numerical methods, graphical displays and methods, and perception...
2 KB (109 words) - 18:13, 6 November 2024
Z-order Z-order curve List of combinatorial computational geometry topics List of geometry topics List of graphical methods List of numerical computational...
9 KB (844 words) - 20:40, 8 February 2025
the primary developer of the method, mathematician Stanisław Ulam, was inspired by his uncle's gambling habits. Monte Carlo methods are mainly used in three...
91 KB (10,690 words) - 23:18, 29 April 2025

point-projection perspective (from Latin perspicere 'to see through') is one of two types of graphical projection perspective in the graphic arts; the other is parallel...
35 KB (3,572 words) - 03:49, 16 May 2025

popes from the Conti family List of popes from the Medici family List of sexually active popes List of popes (graphical) No longer inhabited; These lands...
208 KB (2,611 words) - 14:29, 17 June 2025
Logic optimization (redirect from Graphical minimization methods)
Based on type of execution Graphical optimization methods Tabular optimization methods Algebraic optimization methods Graphical methods represent the...
16 KB (1,657 words) - 13:37, 23 April 2025
calculations for protein structures. Using a graphical model to represent the protein structure allows the solution of many problems including secondary structure...
9 KB (1,423 words) - 11:34, 21 November 2022

Chart (redirect from Graphical methods)
A chart (sometimes known as a graph) is a graphical representation for data visualization, in which "the data is represented by symbols, such as bars...
13 KB (1,513 words) - 22:21, 24 May 2025
Computational Statistics & Data Analysis Journal of Computational and Graphical Statistics Journal of Statistical Computation and Simulation Statistics...
7 KB (370 words) - 22:15, 7 January 2025