
An area chart or area graph displays graphically quantitative data. It is based on the line chart. The area between axis and line are commonly emphasized...
3 KB (349 words) - 05:12, 16 September 2023

pie chart (or a circle chart) is a circular statistical graphic which is divided into slices to illustrate numerical proportion. In a pie chart, the...
22 KB (2,340 words) - 01:45, 6 May 2025

Timeline chart Organizational chart Tree chart Flow chart Area chart Cartogram Pedigree chart Radial tree Examples of less common charts are: Bubble chart Polar...
13 KB (1,513 words) - 22:21, 24 May 2025
Canada aviation, terminal area charts are aeronautical charts intended for navigation under Visual Flight Rules that depict areas surrounding major airports...
2 KB (249 words) - 17:22, 20 January 2025
navigation charts), and many types in between. Visual flight charts are categorized according to their scale, which is proportional to the size of the area covered...
4 KB (583 words) - 23:36, 13 January 2025

A bar chart or bar graph is a chart or graph that presents categorical data with rectangular bars with heights or lengths proportional to the values that...
7 KB (811 words) - 20:27, 20 June 2025

A nautical chart or hydrographic chart is a graphic representation of a sea region or water body and adjacent coasts or banks. Depending on the scale...
18 KB (2,301 words) - 00:26, 14 June 2025

chart is also known as web chart, spider chart, spider graph, spider web chart, star chart, star plot, cobweb chart, irregular polygon, polar chart,...
20 KB (2,497 words) - 06:58, 5 March 2025
lower-alveolar percussive [¡] IPA vowel chart with audio IPA consonant chart with audio International Phonetic Alphabet chart for English dialects Extensions...
13 KB (170 words) - 04:16, 14 June 2025

New York Times. Retrieved December 4, 2024. New York area aviation chart (VFR Terminal Area Chart) (high-resolution TIFF, ~31 MB) Hudson, Edward (July...
40 KB (4,182 words) - 02:21, 13 June 2025

Blackpink in Your Area is the first Japanese compilation album and first double album by South Korean girl group Blackpink. The album was released through...
18 KB (1,011 words) - 05:24, 16 March 2025

The Smith chart (sometimes also called Smith diagram, Mizuhashi chart (水橋チャート), Mizuhashi–Smith chart (水橋スミスチャート), Volpert–Smith chart (Диаграмма Вольперта—Смита)...
68 KB (7,969 words) - 03:12, 23 March 2025
scorecard charts. Area charts are similar to time series charts as users can only set a date or time on the chart's X-axis. The Area Chart, however, has...
16 KB (1,813 words) - 11:56, 24 June 2025

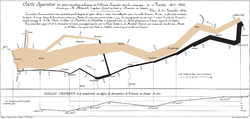
graphs, bar charts, line graphs, area charts, and histograms. In his work, Statistical Breviary, he is credited with introducing the first pie chart. Around...
40 KB (4,817 words) - 03:25, 20 May 2025

mean lower low water (MLLW). In non-tidal areas, e.g. the Baltic Sea, mean sea level (MSL) is used. A chart datum is a type of vertical datum and must...
10 KB (1,220 words) - 20:30, 20 April 2025
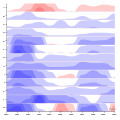
referred to the resulting visualizations as horizon charts. The horizon chart is a variation of the area chart. Having established a horizontal axis, negative...
9 KB (1,020 words) - 15:33, 16 August 2024
Horoscope (redirect from Natal chart)
chart, astrological chart, astro-chart, celestial map, sky-map, star-chart, cosmogram, vitasphere, radical chart, radix, chart wheel or simply chart)...
34 KB (4,336 words) - 14:06, 4 June 2025
Swiss Hitparade (redirect from Swiss Singles Chart)
music sales charts. The charts are a record of the highest-selling singles and albums in various genres in Switzerland. The Swiss charts include: Singles...
2 KB (154 words) - 22:42, 8 February 2025
Chart.js is a free, open-source JavaScript library for data visualization, which supports eight chart types: bar, line, area, pie (doughnut), bubble, radar...
4 KB (239 words) - 16:18, 6 June 2025

by terminal area charts (TACs) at 1:250,000 scale for the areas around major U.S. airports, and until 2016 by World Aeronautical Charts (WACs) at a scale...
4 KB (395 words) - 17:21, 20 January 2025

A candlestick chart (also called Japanese candlestick chart or K-line) is a style of financial chart used to describe price movements of a security, derivative...
8 KB (1,013 words) - 11:45, 2 January 2025
Data and information visualization (category Statistical charts and diagrams)
visualization include charts and graphs (e.g. pie charts, bar charts, line charts, area charts, cone charts, pyramid charts, donut charts, histograms, spectrograms...
89 KB (8,242 words) - 04:50, 24 June 2025

area only shows the long-disused Groom Mine, but USGS aerial photographs of the site in 1959 and 1968 were publicly available. A civil aviation chart...
86 KB (9,571 words) - 14:59, 2 June 2025

Alabama statistical areas List of metropolitan statistical areas List of combined statistical areas "Alabama metro area chart". Al.com. 3 December 2021...
4 KB (74 words) - 00:17, 14 February 2025
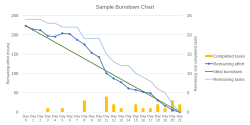
A burndown chart or burn-down chart is a graphical representation of work left to do versus time. The outstanding work (or backlog) is often on the vertical...
8 KB (1,010 words) - 01:27, 16 October 2024
ISBN 9780793540426 – via Google Books. "Ry Cooder The Slide Area Chart History". Billboard. "The Slide Area - Ry Cooder | Songs, Reviews, Credits". AllMusic. "Robert...
5 KB (429 words) - 17:29, 12 February 2025

experiences a disk's size in terms of its diameter, rather than area. This is why most charting software requests the radius or diameter of the bubble as the...
8 KB (976 words) - 19:30, 10 July 2024

aeronautical charts." Some prohibited airspace may be supplemented via NOTAMs. For example, Prohibited Area 40 (P-40) and Restricted Area 4009 (R4009)...
23 KB (2,428 words) - 22:12, 17 June 2025

area chart drawings". Burns. 26 (2): 156–170. doi:10.1016/S0305-4179(99)00047-9. PMID 10716359. Kalra, S. (February 2006). "Assessment of burn area:...
6 KB (679 words) - 01:27, 16 June 2025
urban areas in the world by area. This table shows all cities or municipalities with a total area of at least 50,000 km2. Administrative areas without...
26 KB (1,279 words) - 04:33, 20 May 2025