In probability theory and statistics, the coefficient of variation (CV), also known as normalized root-mean-square deviation (NRMSD), percent RMS, and...
30 KB (4,017 words) - 13:36, 17 April 2025
Root mean square deviation (section RMSD of a sample)
of the measurements, the term coefficient of variation of the RMSD, CV(RMSD) may be used to avoid ambiguity. This is analogous to the coefficient of variation...
11 KB (1,620 words) - 18:39, 16 February 2025
In statistics, McKay's approximation of the coefficient of variation is a statistic based on a sample from a normally distributed population. It was introduced...
3 KB (450 words) - 14:29, 26 April 2023
index of dispersion, dispersion index, coefficient of dispersion, relative variance, or variance-to-mean ratio (VMR), like the coefficient of variation, is...
10 KB (1,274 words) - 01:26, 3 October 2024
Reference range (category Wikipedia articles published in WikiJournal of Medicine)
increasing coefficient of variation, and its "critical" coefficient of variation of 0.213 corresponds to a ratio of (upper limit)/(lower limit) of 2.43, so...
38 KB (5,294 words) - 18:36, 30 July 2024
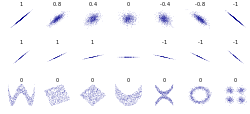
coefficient (PCC) is a correlation coefficient that measures linear correlation between two sets of data. It is the ratio between the covariance of two...
58 KB (8,398 words) - 22:46, 30 May 2025

Statistical dispersion (redirect from Variation (statistics))
These include: Coefficient of variation Quartile coefficient of dispersion Relative mean difference, equal to twice the Gini coefficient Entropy: While...
7 KB (936 words) - 23:55, 23 June 2024
A correlation coefficient is a numerical measure of some type of linear correlation, meaning a statistical relationship between two variables. The variables...
8 KB (754 words) - 05:11, 27 February 2025

Spearman's rank correlation coefficient or Spearman's ρ is a number ranging from -1 to 1 that indicates how strongly two sets of ranks are correlated. It...
33 KB (4,340 words) - 15:33, 28 May 2025
distribution as it has a coefficient of variation less than one, compared to the hyper-exponential distribution which has coefficient of variation greater than one...
11 KB (1,758 words) - 10:15, 12 November 2024
Failure rate (section Coefficient of variation)
rate is decreasing the coefficient of variation is ⩾ 1, and when the failure rate is increasing the coefficient of variation is ⩽ 1.[clarification needed]...
24 KB (3,224 words) - 13:57, 20 May 2025
Income inequality metrics (redirect from List of measures of inequality)
the Gini coefficient in practice, CV puts higher weight on the right tail of the scale, making it sensitive to the rich. Coefficient of variation may be...
64 KB (7,824 words) - 12:26, 23 May 2025
Linear regression (redirect from Coefficient of regression)
make a prediction of the response. If the goal is to explain variation in the response variable that can be attributed to variation in the explanatory...
75 KB (10,482 words) - 17:25, 13 May 2025
to outliers than measures such as the coefficient of variation. As such, it is one of several robust measures of scale. The statistic is easily computed...
2 KB (289 words) - 23:16, 20 January 2025
In statistics, the phi coefficient, or mean square contingency coefficient, denoted by φ or rφ, is a measure of association for two binary variables. In...
25 KB (3,802 words) - 20:08, 23 May 2025
index and Dice's coefficient. Other variations include the "similarity coefficient" or "index", such as Dice similarity coefficient (DSC). Common alternate...
14 KB (1,794 words) - 21:26, 5 March 2025

Photovoltaic effect (section Effect of the temperature)
they are the following: – β Coefficient of variation of VOC with respect to T, given by ∂VOC/∂T. – α Coefficient of variation of ISC with respect to T, given...
11 KB (1,337 words) - 16:03, 24 May 2025

that of the exponential distribution, whose coefficient of variation is 1, and the hypoexponential distribution, which has a coefficient of variation smaller...
4 KB (754 words) - 19:34, 9 May 2025
the coefficient of variation. More subtly, while one can define moments about the origin, only central moments are meaningful, since the choice of origin...
38 KB (4,653 words) - 11:42, 29 May 2025
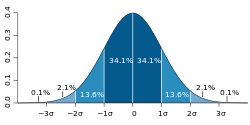
In statistics, the standard deviation is a measure of the amount of variation of the values of a variable about its mean. A low standard deviation indicates...
59 KB (8,233 words) - 19:16, 23 April 2025

be analogous to the coefficient of variation, for describing multiplicative variation in log-normal data, but this definition of GCV has no theoretical...
90 KB (12,551 words) - 22:45, 22 May 2025
In statistics, the Kendall rank correlation coefficient, commonly referred to as Kendall's τ coefficient (after the Greek letter τ, tau), is a statistic...
31 KB (5,437 words) - 21:11, 2 April 2025

Standard score (section Relative importance of variables in multiple regression: standardized regression coefficients)
to the population of healthy 30-year-old adults, and has the usual mean of 0 and standard deviation of 1. Coefficient of variation Error function Mahalanobis...
16 KB (1,936 words) - 16:39, 24 May 2025

spread in comparison to the typical size of data values include the coefficient of variation. The Gini coefficient was originally developed to measure income...
6 KB (541 words) - 01:53, 11 January 2024
invariant, dimensionless measure for characteristics of a distribution is the coefficient of variation, σ / μ {\displaystyle \sigma /\mu } . However, this...
5 KB (419 words) - 21:10, 14 April 2025
Design effect (category CS1 maint: DOI inactive as of November 2024)
Kish's definition of the design effect is closely tied to the coefficient of variation (Kish also calls it relvariance or relvar for short) of the weights (when...
97 KB (13,071 words) - 13:31, 26 May 2025
and μ* are the coefficient of variation and the mean of the distribution respectively.. The geometric (G), arithmetic and harmonic means of the distribution...
38 KB (5,958 words) - 15:58, 30 May 2025
Confidence interval (redirect from Confidence coefficient)
was: how to characterize non-dogmatically the precision of an estimated regression coefficient? ... Pytkowski's monograph ... appeared in print in 1932...
31 KB (3,989 words) - 17:02, 5 May 2025
Reliability (statistics) (redirect from Coefficient of reliability)
R(t)=\exp(-\lambda t),} where λ {\textstyle \lambda } is the failure rate. Coefficient of variation Congeneric reliability Consistency (statistics) Homogeneity (statistics)...
20 KB (2,592 words) - 15:50, 29 May 2025

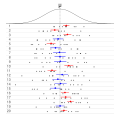
known as a joyplot) is a series of line plots that are combined by vertical stacking to allow the easy visualization of changes through space or time....
2 KB (161 words) - 15:06, 1 June 2025