In statistics, a contingency table (also known as a cross tabulation or crosstab) is a type of table in a matrix format that displays the multivariate...
15 KB (1,965 words) - 02:49, 31 July 2025
Confusion matrix (redirect from Table of confusion)
e. commonly mislabeling one as another). It is a special kind of contingency table, with two dimensions ("actual" and "predicted"), and identical sets...
18 KB (1,926 words) - 05:17, 23 June 2025
logic Contingency plan, in planning Contingency (electrical grid), in electrical grid engineering Contingency table, in statistics Contingency theory...
910 bytes (130 words) - 01:15, 25 June 2024
reporting Comparison of office suites Comparison of OLAP servers Contingency table, a crosstab that tallies counts, rather than totals Data drilling...
20 KB (2,107 words) - 22:47, 2 July 2025

Chi-squared test (category Statistical tests for contingency tables)
variables (two dimensions of the contingency table) are independent in influencing the test statistic (values within the table). The test is valid when the...
22 KB (2,432 words) - 08:54, 18 July 2025
Fisher's exact test (category Statistical tests for contingency tables)
test) is a statistical significance test used in the analysis of contingency tables. Although in practice it is employed when sample sizes are small,...
29 KB (4,053 words) - 14:47, 6 July 2025
Ranking (redirect from School league table)
rearranged into ascending order. In sports, standings, rankings, or league tables group teams of a particular league, conference, or division in a chart based...
17 KB (2,416 words) - 05:56, 14 May 2025
test χ 2 {\displaystyle \chi ^{2}} test nominal non-parametric No Contingency table, sample size > ca. 60, any cell content ≥ 5, marginal totals fixed...
12 KB (755 words) - 05:06, 18 July 2025
Odds ratio (category Summary statistics for contingency tables)
{\displaystyle H_{N}=594} stayed healthy. We can organize this in a contingency table: Diseased Healthy Exposed 20 380 Not exposed 6 594 {\displaystyle...
49 KB (7,070 words) - 18:03, 18 July 2025
Yates's correction for continuity (section 2 × 2 table)
statistical test commonly used when analyzing count data organized in a contingency table, particularly when sample sizes are small. It is specifically designed...
4 KB (600 words) - 09:01, 17 May 2025
r = Number of rows of the contingency table (i.e. number of distinct x i ) c = Number of columns of the contingency table (i.e. number of distinct y...
32 KB (5,433 words) - 07:33, 3 July 2025
is the statistical process of adjusting data sample weights of a contingency table to match desired marginal totals. "1. How different weighting methods...
1 KB (80 words) - 11:40, 8 March 2024
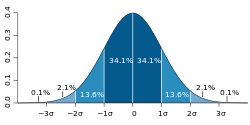
standard deviations of the mean is at least as much as given in the following table. The central limit theorem states that the distribution of an average of...
59 KB (8,278 words) - 02:30, 10 July 2025
during that time. Such scenarios can be represented using a two-by-two contingency table with the number of elements that had each of the combination of events...
39 KB (6,432 words) - 15:45, 18 July 2025
another gold standard test – and cross tabulates the data into a 2×2 contingency table, comparing the two classifications. One then evaluates the classifier...
21 KB (3,297 words) - 16:34, 19 July 2025

argued to be flawed as they ignore the true negative cell of the contingency table, and they are easily manipulated by biasing the predictions. The first...
23 KB (3,747 words) - 21:15, 17 July 2025
Frequency (statistics) (redirect from Frequency distribution table)
into the following frequency table. Bivariate joint frequency distributions are often presented as (two-way) contingency tables: The total row and total column...
13 KB (1,590 words) - 21:01, 12 May 2025

Student's t-distribution (redirect from T-table)
distribution Multivariate Student distribution Standard normal table (Z-distribution table) t statistic Tau distribution, for internally studentized residuals...
55 KB (6,423 words) - 01:28, 22 July 2025
Receiver operating characteristic (category Summary statistics for contingency tables)
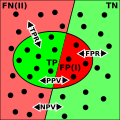
for some condition. The four outcomes can be formulated in a 2×2 contingency table or confusion matrix, as follows: the number of real positive cases...
62 KB (7,929 words) - 05:43, 2 July 2025
Phi coefficient (redirect from Mean square contingency coefficient)
In statistics, the phi coefficient, or mean square contingency coefficient, denoted by φ or rφ, is a measure of association for two binary variables....
25 KB (3,802 words) - 19:09, 25 July 2025
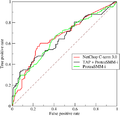
Total operating characteristic (category Summary statistics for contingency tables)
multiple possible thresholds. Each threshold generates a two-by-two contingency table, which contains four entries: hits, misses, false alarms, and correct...
24 KB (2,975 words) - 08:36, 5 December 2024
Uncertainty coefficient (category Summary statistics for contingency tables)
In statistics, the uncertainty coefficient, also called proficiency, entropy coefficient or Theil's U, is a measure of nominal association. It was first...
5 KB (667 words) - 03:08, 22 December 2024
linear model form of regression analysis used to model count data and contingency tables. Poisson regression assumes the response variable Y has a Poisson...
18 KB (2,750 words) - 19:37, 4 July 2025
Continuous data Count data Index of dispersion Summary tables Contingency table Frequency distribution Grouped data Dependence Partial correlation Pearson...
73 KB (9,533 words) - 20:30, 23 July 2025
(incorrect negative assignments). These can be arranged into a 2×2 contingency table, with rows corresponding to actual value – condition positive or condition...
12 KB (1,428 words) - 02:52, 25 May 2025

{\displaystyle {\frac {ad}{bc}}} where a, b, c and d are cells in a 2×2 contingency table. If there are multiple explanatory variables, the above expression...
121 KB (19,414 words) - 03:19, 24 July 2025
failure. Let N describe the number of all marbles in the urn (see contingency table below) and K describe the number of green marbles, then N − K corresponds...
29 KB (4,095 words) - 00:31, 30 July 2025
Polychoric correlation (category Summary statistics for contingency tables)
In statistics, polychoric correlation is a technique for estimating the correlation between two hypothesised normally distributed continuous latent variables...
4 KB (440 words) - 13:06, 18 March 2023

Interquartile range (section Data set in a table)
ordinary median. The following table has 13 rows, and follows the rules for the odd number of entries. For the data in this table the interquartile range is...
10 KB (1,131 words) - 00:32, 18 July 2025
False discovery rate (category Summary statistics for contingency tables)
\left[V/R|R>0\right]\cdot \mathrm {P} \!\left(R>0\right)} . The following table defines the possible outcomes when testing multiple null hypotheses. Suppose...
32 KB (4,564 words) - 02:01, 4 July 2025