ggplot2 is an open-source data visualization package for the statistical programming language R. Created by Hadley Wickham in 2005, ggplot2 is an implementation...
14 KB (1,302 words) - 22:03, 20 July 2025

and Rice University. His work includes the data visualisation system ggplot2 and the tidyverse, a collection of R packages for data science based on...
11 KB (842 words) - 21:38, 13 July 2025
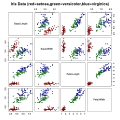
ggally. install.packages(c("ggplot2","GGally")) # install packages if you don't have it. #Load libraries. library(ggplot2) library(GGally) # Plot scatter...
19 KB (1,027 words) - 11:59, 27 July 2025
Wickham was known for working on packages such as ggplot2 and plyr. Chang was known for also working on ggplot2, and publishing the book R Graphics Cookbook...
14 KB (1,033 words) - 21:32, 13 July 2025
A violin plot created with the R package ggplot2 for data visualization...
69 KB (5,990 words) - 11:33, 20 July 2025

Claus O. Fundamentals of Data Visualization. "Violin plot — geom_violin". ggplot2.tidyverse.org. Retrieved 2023-11-19. Wikimedia Commons has media related...
4 KB (483 words) - 20:00, 9 July 2025
book The Grammar of Graphics, which was the foundation for the R package ggplot2. Wilkinson was born on November 5, 1944, to Kirk C. Wilkinson, an art editor...
12 KB (896 words) - 21:28, 13 July 2025

plots. There are a number of ways to create sina plots, in particular: The ggplot2 library of the R programming language used together with the ggforce package...
3 KB (315 words) - 00:17, 20 June 2025
are visualization tools implementing a grammar of graphics, similar to ggplot2. The Vega and Vega-Lite grammars extend Leland Wilkinson's Grammar of Graphics...
5 KB (344 words) - 21:26, 13 July 2025
Heuristic performance on the German city data set, generated with ggplot2 based on data in. See the steps to reproduce on CRAN....
11 KB (1,588 words) - 18:22, 5 August 2024
data import, cleaning, transformation and visualisation (notably with the ggplot2 package). The R Infrastructure packages support coding and the development...
22 KB (2,012 words) - 00:00, 24 May 2025

plots became popular as they became available as an R-library based on ggplot2, and were subsequently re-implemented in various programming languages...
7 KB (675 words) - 16:01, 8 April 2025
Geogebra – Geometry and algebra C.a.R. CaRMetal DrGeo Kig KSEG Chart.js D3.js ggplot2 Graphics Layout Engine Gnuplot Grace Matplotlib Plotly PLplot PyX ROOT...
79 KB (5,811 words) - 13:20, 27 July 2025
graphs with Jupyter notebook. Figure converters which convert matplotlib, ggplot2, and IGOR Pro graphs into interactive, online graphs. Plotly provides a...
22 KB (1,289 words) - 13:36, 24 June 2025
Designed for use in schools and educational settings. Chart.js D3.js ggplot2 Graphics Layout Engine Gnuplot Grace Matplotlib Plotly PLplot PyX ROOT...
16 KB (1,701 words) - 05:22, 18 July 2025
very useful for psychologists. Among others, "lavaan", "sem", "ltm", "ggplot2" are some of the popular packages. PSPP and KNIME are other free packages...
14 KB (1,646 words) - 16:37, 13 April 2025
provide functionality to model, transform, and visualize data, include: ggplot2 – for data visualization dplyr – for wrangling and transforming data tidyr...
11 KB (887 words) - 23:20, 10 May 2025
of the Tukey's range test directly). Compact Letter Displays in R using ggplot2 Set up a compact letter display of all pair-wise comparisons Compact Letter...
11 KB (1,269 words) - 17:03, 23 June 2025
lumi RGtk2 Rhea Rmetrics rnn RQDA Shiny SimpleITK Statcheck tidyverse ggplot2 dplyr knitr Interfaces Emacs Speaks Statistics Java GUI for R KH Coder...
4 KB (330 words) - 04:59, 23 January 2025

elected fellow of American Statistical Association in 2015, known for ggplot2 and tidy data Mary Carrington, M.S., Ph.D., director of the basic science...
65 KB (6,517 words) - 09:11, 24 July 2025
functions from other R packages Other R packages suggested for mapping • igraph for social network • ggplot2 for bi-dimensional maps • cluster for dendrogram...
7 KB (497 words) - 20:06, 10 December 2023

Windows Networks and complex systems, dynamic and hierarchical graphs ggplot2 R GPL2 Yes 2007 December 30, 2016 / 2.2.1 Cross-platform Based on The Grammar...
23 KB (225 words) - 06:46, 27 June 2025
where colors represent the estimated expression level. Packages like ggplot2 in R and Matplotlib in Python are often used to create the visuals. The...
33 KB (3,862 words) - 18:08, 23 July 2025
predictions, group averages and contrasts. see: This package interfaces with ggplot2 to create visual plots. report: This package implements an automated reporting...
11 KB (957 words) - 03:52, 9 June 2025

ISSN 2073-445X. Raab, Marcel (2022), ggseqplot: Render Sequence Plots using 'ggplot2', CRAN, retrieved 2022-07-30 Robette, Nicolas (2020-06-29), seqhandbook:...
98 KB (10,207 words) - 17:04, 18 July 2025