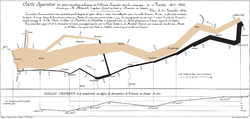
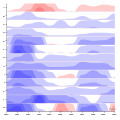
Graphical perception is the human capacity for visually interpreting information on graphs and charts. Both quantitative and qualitative information can...
7 KB (765 words) - 22:55, 31 March 2025
Data and information visualization (redirect from Graphical tools)
2016 – via YouTube. Cleveland, W. S.; McGill, R. (1985). "Graphical perception and graphical methods for analyzing scientific data". Science. 229 (4716):...
82 KB (7,728 words) - 15:38, 27 June 2025
Depth perception is the ability to perceive distance to objects in the world using the visual system and visual perception. It is a major factor in perceiving...
39 KB (5,085 words) - 17:41, 4 February 2025
of Psychology at the University of Toronto, known for his work on graphical perception, psychometric methods and the history of statistical graphics, specifically...
5 KB (495 words) - 20:37, 21 January 2025
A radar chart is a graphical method of displaying multivariate data in the form of a two-dimensional chart of three or more quantitative variables represented...
20 KB (2,497 words) - 06:58, 5 March 2025
self-fulfilling prophecy. Aphantasia Baddeley's model of working memory Graphical perception Nonverbal learning disorder (visual-spatial learning disorder) Proof...
10 KB (1,191 words) - 09:38, 6 December 2023
The history of the graphical user interface, understood as the use of graphic icons and a pointing device to control a computer, covers a five-decade...
61 KB (7,479 words) - 16:11, 4 June 2025
as a single image where different regions are updated over time. Graphical perception Spatial visualization ability Visual language Tufte, Edward R. (1990)...
27 KB (3,072 words) - 15:32, 27 June 2025
founding of Trifacta. Other research contributions include work on the graphical perception of visualizations, social data analysis, text visualization, and...
8 KB (567 words) - 02:37, 8 June 2025
William S., and Robert McGill. "Graphical perception: Theory, experimentation, and application to the development of graphical methods." Journal of the American...
5 KB (504 words) - 18:22, 19 April 2025
"Sizing the horizon: The effects of chart size and layering on the graphical perception of time series visualizations". Proceedings of the SIGCHI Conference...
9 KB (1,020 words) - 15:33, 16 August 2024
computational and graphical methods in statistics and data analysis, including numerical methods, graphical displays and methods, and perception. It is published...
2 KB (109 words) - 18:13, 6 November 2024
Infographic (redirect from Graphical display)
Quantitative Information, Edward Tufte defines "graphical displays" in the following passage: Graphical displays should show the data induce the viewer...
40 KB (4,817 words) - 03:25, 20 May 2025
Ambiguous image (category Perception)
reversible figures are visual forms that create ambiguity by exploiting graphical similarities and other properties of visual system interpretation between...
23 KB (2,910 words) - 17:24, 10 October 2024
Computer graphics (redirect from Graphical computing)
heavily on the underlying sciences of geometry, optics, physics, and perception. Computer graphics is responsible for displaying art and image data effectively...
71 KB (8,858 words) - 09:39, 30 June 2025
6, pp. 59–67, Jun. 2010. J. Heer and M. Bostock, “Crowdsourcing graphical perception: using mechanical turk to assess visualization design,” in Proceedings...
11 KB (1,448 words) - 05:34, 22 January 2025
Harmony (redirect from The perception of harmony)
from music theoretical traditions and the field of psychoacoustics, its perception in large part consists of recognizing and processing consonance, a concept...
39 KB (5,178 words) - 17:12, 24 May 2025
Progress bar (category Graphical control elements)
an individual file. Finally, the graphical design of progress bars has also been shown to influence humans' perception of duration. Wikimedia Commons has...
5 KB (647 words) - 23:10, 19 April 2024
Video game graphics (redirect from Graphical video game)
are typically easier to write and require less processing power than graphical games, and thus were more common from 1970 to 1990. However, terminal...
22 KB (2,645 words) - 13:46, 2 December 2024
famous video game glitches of all time. Encountering MissingNo. causes graphical anomalies and changes gameplay by increasing the number of items in the...
24 KB (2,451 words) - 07:34, 29 June 2025
In the run up to the Guatemalan general election scheduled to take place on 25 June 2023, various organisations carry out opinion polling to gauge voting...
47 KB (1,735 words) - 07:49, 27 September 2023
apart, their beat frequency starts to approach the range of human pitch perception, the beating starts to sound like a note, and a combination tone is produced...
13 KB (1,443 words) - 09:39, 11 May 2025
Visual arts (redirect from Graphical image development)
“photograph,” reflecting electronic capture and the broader concept of graphical representation in optics and computing. Architecture is the process and...
46 KB (4,672 words) - 09:42, 18 June 2025
Computer representation of surfaces Glossary of computer graphics Graphical perception Spatial visualization ability Visualization (graphics) Rost, Randi...
2 KB (161 words) - 04:47, 26 December 2024
classify the objects to make it easier to work with pictures and graphical perception and processing. The human brain is much more aware of how it solves...
8 KB (909 words) - 08:28, 8 February 2025
graphics to enhance the perception of distance by shading distant objects differently. Because many of the shapes in graphical environments are relatively...
3 KB (272 words) - 19:12, 3 December 2024
Statistical graphics (redirect from Statistics graphical technique)
Statistical graphics, also known as statistical graphical techniques, are graphics used in the field of statistics for data visualization. Whereas statistics...
7 KB (708 words) - 05:29, 5 May 2025
Affordance (category Perception)
best-known definition is from his 1979 book, The Ecological Approach to Visual Perception: The affordances of the environment are what it offers the animal, what...
29 KB (3,653 words) - 01:54, 28 June 2025
kinaesthetic and haptic. All perceptions mediated by cutaneous and kinaesthetic sensibility are referred to as tactual perception. The sense of touch may be...
52 KB (5,473 words) - 06:35, 24 June 2025
bends, but without branches or loops (i.e. actually labyrinths). The graphical interface was based on John McIntosh's free 4D Maze game. The participating...
45 KB (5,284 words) - 21:23, 27 June 2025


