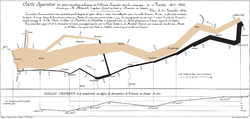
Strategy visualization is any kind of (semi-artistic) infographics for visualization of a business strategy.[citation needed] Visual analytics http://udleditions...
386 bytes (37 words) - 13:12, 30 January 2024
Strategic management (redirect from Business strategy)
Strategy (game theory) Strategy dynamics Strategic planning Strategic Management Society Strategy map Strategy Markup Language Strategy visualization...
121 KB (15,392 words) - 06:06, 28 July 2025
data visualization include charts and graphs, geospatial maps, figures, correlation matrices, percentage gauges, etc.. Information visualization deals...
82 KB (7,723 words) - 07:12, 11 July 2025

Real-time strategy (RTS) is a subgenre of strategy video games that does not progress incrementally in turns, but allow all players to play simultaneously...
62 KB (7,388 words) - 03:45, 8 June 2025
Framework), reduce their planning risk by following the four steps of visualizing strategy, create new demand by unlocking the three tiers of non-customers...
24 KB (2,595 words) - 19:35, 2 July 2025
World. Howson, Cindi (February 14, 2013). "MicroStrategy Doubles Down On Mobile, Data Visualization". InformationWeek. Jaffe, Harry (March 1, 2000)....
26 KB (2,188 words) - 07:13, 15 July 2025
Revenue shortfall Strategy dynamics Strategic planning Strategic Management Society Strategy map Strategy Markup Language Strategy visualization Six Forces Model...
4 KB (557 words) - 21:48, 15 July 2025
Minimax (redirect from Minimax strategy)
Mathematics, EMS Press, 2001 [1994] "Mixed strategies". cut-the-knot.org. Curriculum: Games. — A visualization applet "Maximin principle". Dictionary of...
27 KB (3,815 words) - 03:08, 30 June 2025

Infographic (redirect from International Conference on Information Visualization)
see patterns and trends. Similar pursuits are information visualization, data visualization, statistical graphics, information design, or information...
40 KB (4,817 words) - 03:25, 20 May 2025
Chess strategy is the aspect of chess play concerned with evaluation of chess positions and setting goals and long-term plans for future play. While evaluating...
29 KB (3,919 words) - 01:39, 29 April 2025
Mass customization (redirect from Configurator visualization)
strategic advantage and economic value. Mass customization is a product design strategy and is currently used with both delayed differentiation and modular design...
10 KB (1,111 words) - 06:47, 16 March 2025
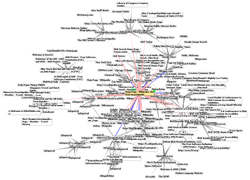
Graph drawing (redirect from Graph visualization)
science combining methods from geometric graph theory and information visualization to derive two-dimensional (or, sometimes, three-dimensional) depictions...
33 KB (3,554 words) - 05:14, 15 July 2025

Digital marketing (redirect from Social media strategy)
digital marketing communication: Bibliometric analysis and network visualization from key articles". Journal of Business Research. 130: 552–63. doi:10...
90 KB (9,913 words) - 23:33, 14 July 2025
Biological data visualization is a branch of bioinformatics concerned with the application of computer graphics, scientific visualization, and information...
61 KB (6,673 words) - 00:50, 29 July 2025
Dashboard (computing) (redirect from Dashboard (visualization))
for "progress report" or "report" and is considered a form of data visualization. The dashboard is often accessible by a web browser and is typically...
26 KB (3,168 words) - 10:08, 6 July 2025

R/K selection theory (redirect from R-strategy)
the concept of the evolution of life history strategies has a longer history (see e.g. plant strategies). The theory was popular in the 1970s and 1980s...
30 KB (3,195 words) - 13:54, 22 July 2025
Product design (redirect from Creative visualization (design))
Co-operative Animation: Beyond Creative Visualization in Automotive Design. In Cooperative Design, Visualization, and Engineering. Springer Berlin Heidelberg...
15 KB (1,955 words) - 12:06, 4 July 2025
Reading comprehension (redirect from Reading strategies)
They can share their visualizations, then check their level of detail against the illustrations. Partner reading is a strategy created for reading pairs...
48 KB (5,868 words) - 14:54, 18 July 2025
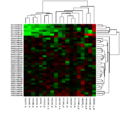
Heat map (category Data and information visualization)
A heat map (or heatmap) is a 2-dimensional data visualization technique that represents the magnitude of individual values within a dataset as a color...
36 KB (3,878 words) - 15:07, 18 July 2025
from Pixar about their mental visualization and found that the production managers tended to have stronger visualizations than the artists. Gordon Clark...
41 KB (4,389 words) - 01:04, 27 July 2025
"creative visualization" signifies the process by which a person generates and processes visual mental imagery specifically. However, creative visualization is...
37 KB (5,032 words) - 05:30, 19 July 2025

First-person shooter (redirect from Real Time Strategy Shooter)
tend to be more realistic, and require the players to use teamwork and strategy in order to succeed; the players can often command a squad of characters...
151 KB (15,723 words) - 06:18, 25 July 2025
In information visualization and graphic design, Truchet tiles are square tiles decorated with patterns that are not rotationally symmetric. When placed...
4 KB (372 words) - 01:21, 27 December 2024

Kobourov, Stephen (2015). "Visualizing Cartograms: Goals and Task Taxonomy". 17th Eurographics Conference on Visualization (Eurovis). arXiv:1502.07792...
41 KB (4,113 words) - 23:55, 4 July 2025
Zoom Schwartz Profigliano (section Strategy)
them with the expectation of a response when speaking a command word or visualizing an expectation of a response from a non-active player who was looked...
9 KB (1,510 words) - 04:18, 13 April 2025

Ben Shneiderman (category Data and information visualization experts)
space-filling approach to the visualization of hierarchical information structures." Visualization, 1991. Visualization'91, Proceedings., IEEE Conference...
30 KB (3,151 words) - 20:37, 21 January 2025
Image collection exploration (section Visualization)
in a visualization layout. Information visualization is an active area that investigates new ways to visualize information by using visualization metaphors...
5 KB (546 words) - 22:50, 16 April 2025
The IEEE Visualization Conference (VIS) is an annual conference on scientific visualization, information visualization, and visual analytics administrated...
18 KB (1,936 words) - 22:57, 19 June 2025

Fourier operator (section Visualization)
transform. Least-squares spectral analysis Advances in machine vision: strategies and applications, Colin Archibald and Emil Petriu, ed., Vol. 32, World...
4 KB (488 words) - 13:57, 3 October 2022
Matches test skills including memorization, numerical calculation and visualization. Combining three different types of pieces forms an octahedron-like...
43 KB (4,592 words) - 19:42, 28 July 2025