
plot, sometimes to a more general class of plots, and sometimes to the less commonly used P–P plot. The probability plot correlation coefficient plot...
21 KB (2,518 words) - 10:49, 4 July 2025
The probability plot correlation coefficient (PPCC) plot is a graphical technique for identifying the shape parameter for a distributional family that...
6 KB (872 words) - 22:01, 22 September 2020
List of statistics articles (redirect from Probability Applications)
error Probability of precipitation Probability plot Probability plot correlation coefficient – redirects to Q–Q plot Probability plot correlation coefficient...
87 KB (8,280 words) - 18:37, 30 July 2025
plot, "quantile–quantile" plot Normal probability plot, a Q–Q plot against the standard normal distribution Probability plot correlation coefficient Probability...
420 bytes (81 words) - 02:47, 21 June 2025
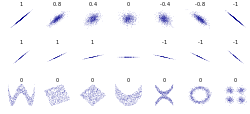
In statistics, the Pearson correlation coefficient (PCC) is a correlation coefficient that measures linear correlation between two sets of data. It is...
58 KB (8,398 words) - 00:35, 24 June 2025
A correlation coefficient is a numerical measure of some type of linear correlation, meaning a statistical relationship between two variables. The variables...
8 KB (754 words) - 04:50, 11 June 2025

In statistics, Spearman's rank correlation coefficient or Spearman's ρ is a number ranging from -1 to 1 that indicates how strongly two sets of ranks...
33 KB (4,320 words) - 00:47, 18 June 2025

distribution is more common than looking at a box plot, it can be useful to compare the box plot against the probability density function (theoretical histogram)...
20 KB (2,992 words) - 09:09, 23 July 2025
In statistics, the Kendall rank correlation coefficient, commonly referred to as Kendall's τ coefficient (after the Greek letter τ, tau), is a statistic...
32 KB (5,433 words) - 07:33, 3 July 2025
product-moment correlation coefficient (PPMCC), or "Pearson's correlation coefficient", commonly called simply "the correlation coefficient". It is obtained...
39 KB (5,359 words) - 04:50, 11 June 2025
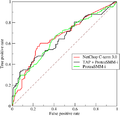
Receiver operating characteristic (redirect from ROC plot)
from the real class) and their geometric mean is the Matthews correlation coefficient.[citation needed] Whereas ROC AUC varies between 0 and 1 — with...
62 KB (7,929 words) - 05:43, 2 July 2025
np-chart p-chart Pie chart Probability plot Normal probability plot Poincaré plot Probability plot correlation coefficient plot Q–Q plot Rankit Run chart Seasonal...
4 KB (335 words) - 04:31, 6 November 2024

A violin plot is a statistical graphic for comparing probability distributions. It is similar to a box plot, with the addition of a rotated kernel density...
4 KB (483 words) - 20:00, 9 July 2025

scatter plot and many other statistical tools to pursue a scientific basis for eugenics. When, in 1886, Galton published a scatter plot and correlation ellipse...
13 KB (1,408 words) - 16:06, 4 August 2025
binary variables. In machine learning, it is known as the Matthews correlation coefficient (MCC) and used as a measure of the quality of binary (two-class)...
25 KB (3,802 words) - 19:09, 25 July 2025

A ridgeline plot (also known as a joyplot) is a series of line plots that are combined by vertical stacking to allow the easy visualization of changes...
2 KB (161 words) - 15:06, 1 June 2025

to the kernel density. Sina plots are similar to violin plots, but while violin plots depict kernel density, sina plots depict the points themselves...
3 KB (315 words) - 00:17, 20 June 2025
correlated in the population). An example is the Pearson product-moment correlation coefficient, which is found by dividing the covariance of the two variables...
35 KB (4,051 words) - 21:58, 23 January 2025
In probability theory and statistics, the coefficient of variation (CV), also known as normalized root-mean-square deviation (NRMSD), percent RMS, and...
30 KB (4,017 words) - 13:36, 17 April 2025

Autocorrelation (redirect from Serial correlation coefficient)
normalize the autocovariance function to get a time-dependent Pearson correlation coefficient. However, in other disciplines (e.g. engineering) the normalization...
40 KB (5,833 words) - 00:42, 20 June 2025
Contingency table (redirect from Contingency coefficient)
tetrachoric correlation coefficient but it is only applicable to 2 × 2 tables. Polychoric correlation is an extension of the tetrachoric correlation to tables...
15 KB (1,965 words) - 02:49, 31 July 2025

a volcano plot is a type of scatter-plot that is used to quickly identify changes in large data sets composed of replicate data. It plots significance...
6 KB (756 words) - 18:50, 18 June 2025

recall), or the Matthews correlation coefficient, which is a geometric mean of the chance-corrected variants: the regression coefficients Informedness (DeltaP')...
23 KB (3,747 words) - 21:15, 17 July 2025
In probability theory and statistics, partial correlation measures the degree of association between two random variables, with the effect of a set of...
24 KB (3,782 words) - 08:17, 28 March 2025
joint-probability of agreement, such as Cohen's kappa, Scott's pi and Fleiss' kappa; or inter-rater correlation, concordance correlation coefficient, intra-class...
19 KB (2,480 words) - 14:11, 26 May 2025

Radar chart (redirect from Star plot)
that plot data as the maximal total area, can be applied to sort the variables (axes) into relative positions that reveal distinct correlations, trade-offs...
20 KB (2,505 words) - 11:37, 21 July 2025
Linear regression (redirect from Regression coefficient)
contrast, the marginal effect of xj on y can be assessed using a correlation coefficient or simple linear regression model relating only xj to y; this effect...
76 KB (10,482 words) - 04:54, 7 July 2025
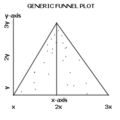
A funnel plot is a graph designed to check for the existence of publication bias; funnel plots are commonly used in systematic reviews and meta-analyses...
7 KB (751 words) - 19:47, 24 May 2025

size will be the signal energy. In probability and statistics, the term cross-correlations refers to the correlations between the entries of two random...
26 KB (4,083 words) - 05:53, 30 April 2025
Tail dependence (category Covariance and correlation)
In probability theory, the tail dependence of a pair of random variables is a measure of their comovements in the tails of the distributions. The concept...
2 KB (275 words) - 08:59, 15 January 2024