
In statistics and probability, quantiles are cut points dividing the range of a probability distribution into continuous intervals with equal probabilities...
31 KB (3,228 words) - 20:22, 24 May 2025

Q–Q plot (redirect from Quantile-Quantile Plot)
plot (quantile–quantile plot) is a probability plot, a graphical method for comparing two probability distributions by plotting their quantiles against...
21 KB (2,518 words) - 00:48, 20 March 2025

In probability and statistics, the quantile function is a function Q : [ 0 , 1 ] ↦ R {\displaystyle Q:[0,1]\mapsto \mathbb {R} } which maps some probability...
17 KB (2,235 words) - 12:04, 29 May 2025

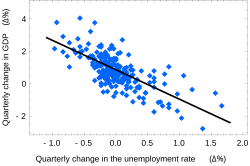
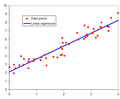
Quantile regression is a type of regression analysis used in statistics and econometrics. Whereas the method of least squares estimates the conditional...
29 KB (4,109 words) - 19:41, 1 May 2025
In statistics, quantile normalization is a technique for making two distributions identical in statistical properties. To quantile-normalize a test distribution...
7 KB (1,242 words) - 03:18, 4 October 2024
In statistics, quartiles are a type of quantiles which divide the number of data points into four parts, or quarters, of more-or-less equal size. The...
16 KB (2,225 words) - 03:52, 26 May 2025
Quantile Regression Averaging (QRA) is a forecast combination approach to the computation of prediction intervals. It involves applying quantile regression...
10 KB (1,297 words) - 19:32, 1 May 2024
A quantile-parameterized distribution (QPD) is a probability distributions that is directly parameterized by data. They were created to meet the need for...
20 KB (2,913 words) - 13:24, 23 May 2025
{\displaystyle F(x)=p} . This defines the inverse distribution function or quantile function. Some distributions do not have a unique inverse (for example...
26 KB (3,993 words) - 17:49, 18 April 2025

Normal distribution (redirect from Normal distribution quantile function)
{e^{-n^{2}/2}}{n{\sqrt {\pi /2}}}}} . The quantile function of a distribution is the inverse of the cumulative distribution function. The quantile function of the standard...
151 KB (22,720 words) - 15:27, 5 June 2025
function of those values; less commonly, the conditional median or some other quantile is used. Like all forms of regression analysis, linear regression focuses...
75 KB (10,482 words) - 17:25, 13 May 2025

In statistics, the logit (/ˈloʊdʒɪt/ LOH-jit) function is the quantile function associated with the standard logistic distribution. It has many uses in...
12 KB (1,515 words) - 02:49, 2 June 2025
expected value of the distribution in a way analogous to that in which the quantiles of the distribution are related to the median. For τ ∈ ( 0 , 1 ) {\textstyle...
2 KB (336 words) - 12:54, 24 April 2025

Skewness (section Quantile-based measures)
statistic that can be used in conjunction with the histogram and the normal quantile plot to characterize the data or distribution. Skewness indicates the direction...
28 KB (3,968 words) - 13:28, 18 April 2025

Logistic distribution (section Quantile function)
function (quantile function) of the logistic distribution is a generalization of the logit function. Its derivative is called the quantile density function...
13 KB (1,789 words) - 17:39, 17 March 2025

k , b ) = 1 − e − b x k , {\displaystyle F(x;k,b)=1-e^{-bx^{k}},} the quantile function is Q ( p ; k , b ) = ( − 1 b ln ( 1 − p ) ) 1 k , {\displaystyle...
39 KB (5,828 words) - 14:22, 28 April 2025

of the Q–Q probability plot for a normal distribution. The theoretical quantiles are generally chosen to approximate either the mean or the median of the...
6 KB (782 words) - 05:36, 16 December 2023

the median is of central importance in robust statistics. Median is a 2-quantile; it is the value that partitions a set into two equal parts. The median...
63 KB (8,022 words) - 02:51, 20 May 2025
valid, with the only exception that the quantile t*n−2 of Student's t distribution is replaced with the quantile q* of the standard normal distribution...
32 KB (5,331 words) - 19:00, 25 April 2025
represents 1/10 of the sample or population. A decile is one possible form of a quantile; others include the quartile and percentile. A decile rank arranges the...
3 KB (301 words) - 20:44, 17 November 2024
distribution function of the standard normal distribution. The formula for the quantile function is G ( p ) = 1 4 [ γ Φ − 1 ( p ) + 4 + ( γ Φ − 1 ( p ) ) 2 ] 2...
7 KB (1,123 words) - 19:34, 28 May 2025
The Thyroid Feedback Quantile-based Index (TFQI) is a calculated parameter for thyrotropic pituitary function. It was defined to be more robust to distorted...
10 KB (978 words) - 03:36, 23 May 2025

ease of fitting to data with linear least squares; simple, closed-form quantile function (inverse CDF) equations that facilitate simulation; a simple,...
46 KB (7,310 words) - 20:48, 22 May 2025

some qualifications discussed below) the sample median and other sample quantiles. When using probability theory to analyze order statistics of random samples...
28 KB (4,933 words) - 10:34, 6 February 2025
different procedures to estimate alternative location parameters (e.g., quantile regression or Necessary Condition Analysis) or estimate the conditional...
37 KB (5,235 words) - 00:11, 29 May 2025

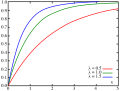
Exponential distribution (section Quantiles)
continuous probability distribution that has a constant failure rate. The quantile function (inverse cumulative distribution function) for Exp(λ) is F − 1...
43 KB (6,647 words) - 17:34, 15 April 2025
1947) is an American econometrician mostly known for his contributions to quantile regression. He is currently a Honorary Professor of Economics at University...
4 KB (284 words) - 04:15, 20 July 2024

This set always contains the mode. A quantile-based credible interval, which is computed by taking the inter-quantile interval [ q δ , q δ + γ ] {\displaystyle...
8 KB (1,037 words) - 22:16, 19 May 2025
to doing weighted mean absolute error (MAE) regression, also known as quantile regression. This property is trivial since g ^ MAPE ( x ) = arg min g...
9 KB (1,481 words) - 07:42, 4 October 2024

In descriptive statistics, a box plot or boxplot is a method for demonstrating graphically the locality, spread and skewness groups of numerical data through...
20 KB (3,012 words) - 00:34, 29 April 2025