
A scatter plot, also called a scatterplot, scatter graph, scatter chart, scattergram, or scatter diagram, is a type of plot or mathematical diagram using...
12 KB (1,332 words) - 17:19, 19 July 2025

pairs, as in a scatter plot, or even for the numbers of values in the two groups being compared to be equal. The term "probability plot" sometimes refers...
21 KB (2,518 words) - 10:49, 4 July 2025

a volcano plot is a type of scatter-plot that is used to quickly identify changes in large data sets composed of replicate data. It plots significance...
6 KB (756 words) - 18:50, 18 June 2025

In descriptive statistics, a box plot or boxplot is a method for demonstrating graphically the locality, spread and skewness groups of numerical data through...
20 KB (2,992 words) - 09:09, 23 July 2025
Plotly is a technical computing company headquartered in Montreal, Quebec, that develops online data analytics and visualization tools. Plotly provides...
22 KB (1,289 words) - 13:36, 24 June 2025

or a one-dimensional scatter plot. Rug plots are often used in combination with two-dimensional scatter plots by placing a rug plot of the x values of the...
1 KB (127 words) - 04:49, 11 October 2023
approaches are visualization (histograms, scatter plots, surface plots, tree maps, parallel coordinate plots, etc.), statistics (hypothesis test, regression...
82 KB (7,723 words) - 07:12, 11 July 2025

right plot of Figure 1, titled 'Log-Log Linear Line with Normal Noise', the relationship becomes linear. This plot also displays a scatter plot of the...
16 KB (2,704 words) - 11:44, 19 June 2025
techniques used in EDA are: Box plot Histogram Multi-vari chart Run chart Pareto chart Scatter plot (2D/3D) Stem-and-leaf plot Parallel coordinates Odds ratio...
19 KB (2,221 words) - 20:43, 25 May 2025
programming, a parameter in network broadcasting Scatter (band), a Scottish improvisational music collective Scatter plot, a type of diagram Scattered (disambiguation)...
502 bytes (91 words) - 21:40, 6 January 2025

GeoDa (section Anselin's Moran scatter plot)
other windows. GeoDa also is capable of producing histograms, box plots, Scatter plots to conduct simple exploratory analyses of the data. The most important...
8 KB (1,086 words) - 10:27, 21 September 2023
Multidimensional scaling (redirect from MDS plot)
possible. For N = 1, 2, and 3, the resulting points can be visualized on a scatter plot. Core theoretical contributions to MDS were made by James O. Ramsay of...
21 KB (3,244 words) - 02:46, 17 April 2025

A violin plot is a statistical graphic for comparing probability distributions. It is similar to a box plot, with the addition of a rotated kernel density...
4 KB (483 words) - 20:00, 9 July 2025

Line chart (redirect from Line plot)
It is a basic type of chart common in many fields. It is similar to a scatter plot except that the measurement points are ordered (typically by their x-axis...
6 KB (779 words) - 11:37, 18 June 2025
Receiver operating characteristic (redirect from ROC plot)
A receiver operating characteristic curve, or ROC curve, is a graphical plot that illustrates the performance of a binary classifier model (can be used...
62 KB (7,929 words) - 05:43, 2 July 2025
in the process. Data and information visualization Scatter plot Wilkinson, Leland (1999). "Dot plots". The American Statistician. 53 (3). American Statistical...
4 KB (564 words) - 09:44, 26 May 2024
simplest form first plots dots in a scatter plot at the positions ( x t , x t + 1 ) {\displaystyle (x_{t},x_{t+1})} , then plots ( x t + 1 , x t + 2 )...
7 KB (962 words) - 18:44, 12 June 2025
Biostatistics (section Scatter plot)
Karl Pearson. A scatter plot is a mathematical diagram that uses Cartesian coordinates to display values of a dataset. A scatter plot shows the data as...
54 KB (6,600 words) - 15:08, 30 July 2025

visualization such as auxiliary plots, images of experimental data, project logos, etc. Scatter plot: VisIt's Scatter plot allows visualizing multivariate...
27 KB (3,063 words) - 18:44, 5 July 2025

Stem-and-leaf display (redirect from Stem-and-leaf plot)
A stem-and-leaf display or stem-and-leaf plot is a device for presenting quantitative data in a graphical format, similar to a histogram, to assist in...
8 KB (1,090 words) - 08:55, 1 July 2025
a scatter plot. This is done so that the relationship (if any) between the variables is easily seen. For example, bivariate data on a scatter plot could...
5 KB (640 words) - 01:28, 10 January 2025
Médéric (3 February 2020). "Table 2: Graph comparison between Scatter plot, Violin + Scatter plot, Heatmap and ViSiElse graph". PeerJ. 8: e8341. doi:10.7717/peerj...
66 KB (7,188 words) - 01:08, 26 July 2025

Hertzsprung–Russell diagram (redirect from Hertzsprung-Russell plot)
Hertzsprung–Russell diagram (abbreviated as H–R diagram, HR diagram or HRD) is a scatter plot of stars showing the relationship between the stars' absolute magnitudes...
23 KB (2,750 words) - 22:46, 23 April 2025

these common infographics, alternatives include stem-and-leaf plots, Q–Q plots, scatter plot matrices (SPLOM) and parallel coordinates. For assessing a collection...
40 KB (4,817 words) - 03:25, 20 May 2025
The Inglehart–Welzel cultural map of the world is a scatter plot created by political scientists Ronald Inglehart and Christian Welzel based on the World...
21 KB (2,376 words) - 14:09, 24 May 2025
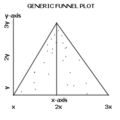
A funnel plot is a graph designed to check for the existence of publication bias; funnel plots are commonly used in systematic reviews and meta-analyses...
7 KB (751 words) - 19:47, 24 May 2025
directory of musical genres, artists, and tracks listed by Spotify, in a scatter plot word map style. Since December 2023, McDonald has no longer been able...
9 KB (955 words) - 17:50, 28 July 2025
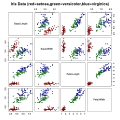
library(GGally) # Plot scatter plot matrix for the iris dataset ggpairs(data = iris, # your iris data columns = 1:4, # columns for the scatter plot mapping =...
19 KB (1,027 words) - 11:59, 27 July 2025

include: scatter plots spectrum plots histograms probability plots residual plots box plots, and block plots Graphical procedures such as plots are a short...
20 KB (2,606 words) - 05:30, 21 July 2025