
A time–distance diagram is generally a diagram with one axis representing time and the other axis distance. Such charts are used in the aviation industry...
13 KB (1,552 words) - 06:14, 16 June 2025

spacetime diagram, referred to as the object's world line. Each point in a spacetime diagram represents a unique position in space and time and is referred...
49 KB (6,178 words) - 20:27, 25 May 2025
Function graph Scatter plot Hanger diagram. Schematics and other types of diagrams, for example: Time–distance diagram Exploded view Population density...
16 KB (1,045 words) - 06:35, 5 March 2025

In mathematics, a Voronoi diagram is a partition of a plane into regions close to each of a given set of objects. It can be classified also as a tessellation...
46 KB (5,504 words) - 02:43, 25 March 2025
Linear scheduling method (redirect from Time versus distance diagram)
construction Linear scheduling Time versus distance diagrams (T-D charts) Time chainage Linear balance charts Velocity diagrams List of project management...
3 KB (273 words) - 05:24, 26 September 2024

The Hertzsprung–Russell diagram (abbreviated as H–R diagram, HR diagram or HRD) is a scatter plot of stars showing the relationship between the stars'...
23 KB (2,762 words) - 22:46, 23 April 2025
Timing diagram may refer to: Digital timing diagram Timing diagram (Unified Modeling Language) Time–distance diagram This disambiguation page lists articles...
358 bytes (48 words) - 23:31, 7 December 2021

between objects. Comoving distance factors out the expansion of the universe, giving a distance that does not change in time except due to local factors...
20 KB (2,679 words) - 16:16, 28 May 2025
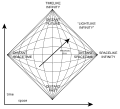
general relativity) of the Minkowski diagram of special relativity where the vertical dimension represents time, and the horizontal dimension represents...
10 KB (1,198 words) - 19:49, 24 May 2025
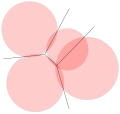
the power distance to C is smaller than the power distance to the other circles. The power diagram is a form of generalized Voronoi diagram, and coincides...
11 KB (1,210 words) - 03:06, 8 October 2024

A constellation diagram is a representation of a signal modulated by a digital modulation scheme such as quadrature amplitude modulation or phase-shift...
7 KB (983 words) - 05:56, 6 March 2025

solar differential rotation profile, a travel-time deviation map for sunspots, and a time–distance diagram from quiet-Sun measurements Used in Invariant...
56 KB (8,853 words) - 23:22, 5 June 2025

In theoretical physics, a Feynman diagram is a pictorial representation of the mathematical expressions describing the behavior and interaction of subatomic...
93 KB (15,967 words) - 18:03, 26 May 2025
Spatiotemporal database Time–distance diagram Tobler's first law of geography Tobler's second law of geography Value of time Thrift & Pred 1981, p. 277;...
39 KB (4,023 words) - 14:09, 20 October 2024
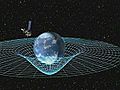
Spacetime (redirect from Space-time distance)
dimension of time into a single four-dimensional continuum. Spacetime diagrams are useful in visualizing and understanding relativistic effects, such...
132 KB (19,765 words) - 09:00, 3 June 2025
of track. Ibry developed a time–distance diagram and ruler to determine train plans and keep trains apart. It shows distance (with train stations) on the...
6 KB (400 words) - 21:52, 17 January 2025
calculating the Fréchet distance of two curves is the free-space diagram, which was introduced by Alt and Godau. The free-space diagram between two curves...
16 KB (1,894 words) - 14:04, 31 March 2025

is an extension of the Voronoi diagram that outputs a real value at a given coordinate that corresponds to the distance of the nth nearest seed (usually...
4 KB (424 words) - 03:22, 15 May 2025
Principle of locality (section Action at a distance)
is repeated many times and the results are compared. A spacetime diagram has a time coordinate going vertical and a space coordinate going horizontal...
23 KB (2,821 words) - 00:44, 3 May 2025

figure below. Note we use conformal time in the following diagrams. Conformal time describes the amount of time it would take a photon to travel from...
13 KB (1,813 words) - 22:50, 5 February 2025

The fundamental diagram of traffic flow is a diagram that gives a relation between road traffic flux (vehicles/hour) and the traffic density (vehicles/km)...
10 KB (1,523 words) - 09:22, 28 June 2023
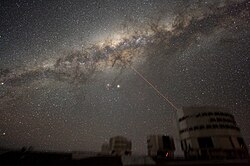
number of stars in different regions of the visible sky. He produced a diagram of the shape of the Milky Way with the Solar System close to the center...
219 KB (22,006 words) - 11:27, 17 June 2025

Mathematical diagrams, such as charts and graphs, are mainly designed to convey mathematical relationships—for example, comparisons over time. A complex...
13 KB (1,582 words) - 06:43, 5 March 2025
A pressure–volume diagram (or PV diagram, or volume–pressure loop) is used to describe corresponding changes in volume and pressure in a system. It is...
10 KB (1,168 words) - 07:18, 24 May 2025
Thermodynamic diagrams are diagrams used to represent the thermodynamic states of a material (typically fluid) and the consequences of manipulating this...
9 KB (1,237 words) - 21:41, 3 April 2025
comoving distance from which light emitted in the past could reach the observer at a given time. For events that occur beyond that distance, light has...
29 KB (3,590 words) - 03:24, 22 May 2025

Tornado diagrams, also called tornado plots, tornado charts or butterfly charts, are a special type of Bar chart, where the data categories are listed...
2 KB (238 words) - 13:16, 15 March 2025

(analēmma) 'support') is a diagram showing the position of the Sun in the sky as seen from a fixed location on Earth at the same mean solar time over the course...
37 KB (4,941 words) - 18:15, 28 May 2025

Parallax in astronomy (category Length, distance, or range measuring devices)
p in the diagram when scaled-down and modified as mentioned above. The lunar horizontal parallax at any time depends on the linear distance of the Moon...
35 KB (5,048 words) - 22:52, 5 June 2025
Vacuum Diagrams is a collection of science fiction short stories by British writer Stephen Baxter. The collection connects the novels of the Xeelee Sequence...
4 KB (400 words) - 20:10, 10 February 2024