
analysis in the presence of heteroscedasticity, which led to his formulation of the autoregressive conditional heteroscedasticity (ARCH) modeling technique...
27 KB (3,197 words) - 00:51, 2 May 2025
Autoregressive conditional heteroskedasticity (redirect from Autoregressive conditional heteroscedasticity)
Garthoff, R. (2018). "Generalised spatial and spatiotemporal autoregressive conditional heteroscedasticity". Spatial Statistics. 26 (1): 125–145. arXiv:1609...
23 KB (3,837 words) - 12:25, 30 June 2025
Linear regression (section Heteroscedastic models)
including weighted least squares and the use of heteroscedasticity-consistent standard errors can handle heteroscedasticity in a quite general way. Bayesian...
76 KB (10,482 words) - 04:54, 7 July 2025

Box plot (redirect from Box-and-whisker diagram)
or boxplot is a method for demonstrating graphically the locality, spread and skewness groups of numerical data through their quartiles. In addition to...
20 KB (2,992 words) - 09:09, 23 July 2025
exhibit a phenomenon called heteroscedasticity. If all of the residuals are equal, or do not fan out, they exhibit homoscedasticity. However, a terminological...
16 KB (2,164 words) - 16:12, 23 May 2025

Aggregate data (section Researchers and analysts)
applied in statistics, data warehouses, and in economics. There is a distinction between aggregate data and individual data. Aggregate data refers to...
22 KB (2,664 words) - 11:26, 3 August 2025

distributed under the null hypothesis, specifically Pearson's chi-squared test and variants thereof. Pearson's chi-squared test is used to determine whether...
22 KB (2,432 words) - 13:34, 5 August 2025

Data (section Etymology and terminology)
organized into structures such as tables that provide additional context and meaning, and may themselves be used as data in larger structures. Data may be used...
24 KB (2,822 words) - 02:05, 28 July 2025
analysis in the presence of heteroscedasticity, which led to his formulation of the autoregressive conditional heteroscedasticity (ARCH) modeling technique...
5 KB (1,150 words) - 18:01, 28 July 2025
population and associated techniques of survey data collection, such as questionnaire construction and methods for improving the number and accuracy of...
35 KB (4,242 words) - 18:13, 24 May 2025

Pie chart (category Statistical charts and diagrams)
proportion. In a pie chart, the arc length of each slice (and consequently its central angle and area) is proportional to the quantity it represents. While...
22 KB (2,340 words) - 19:01, 12 July 2025
Methods engineering (redirect from Time and methods engineering)
Methods engineering is a subspecialty of industrial engineering and manufacturing engineering concerned with human integration in industrial production...
5 KB (616 words) - 04:44, 14 July 2022
Standard error (category Statistical deviation and dispersion)
population and recording the sample mean per sample. This forms a distribution of different means, and this distribution has its own mean and variance....
20 KB (2,781 words) - 01:28, 24 June 2025
(2016-12-19). "Nonnegative Matrix Factorization (NMF) with Heteroscedastic Uncertainties and Missing data". arXiv:1612.06037 [astro-ph.IM]. Ren, Bin; Pueyo...
117 KB (14,851 words) - 14:54, 21 July 2025
numerical value of the mode is the same as that of the mean and median in a normal distribution, and it may be very different in highly skewed distributions...
16 KB (2,010 words) - 08:25, 23 June 2025
psychology, and political science. Monte Carlo methods have been recognized as one of the most important and influential ideas of the 20th century, and they...
92 KB (10,691 words) - 07:32, 30 July 2025

In mathematical optimization and decision theory, a loss function or cost function (sometimes also called an error function) is a function that maps an...
21 KB (2,801 words) - 14:31, 25 July 2025
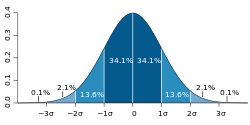
a mean or a standard deviation. If a population exactly follows a known and defined distribution, for example the normal distribution, then a small set...
5 KB (670 words) - 21:17, 7 May 2025
B and C (which compare equal) which are both ranked ahead of D, then A gets ranking number 1 ("first") and D gets ranking number 4 ("fourth"), and either...
17 KB (2,416 words) - 05:56, 14 May 2025
Statistician (category Statistics profession and organizations)
exists in both the private and public sectors. It is common to combine statistical knowledge with expertise in other subjects, and statisticians may work...
7 KB (574 words) - 11:54, 22 January 2025

Logistic regression (section Multinomial logistic regression: Many explanatory variables and many categories)
unit, hence the alternative names. See § Background and § Definition for formal mathematics, and § Example for a worked example. Binary variables are...
121 KB (19,414 words) - 03:19, 24 July 2025
calculating confidence intervals, and the best method depends on the situation. Two widely applicable methods are bootstrapping and the central limit theorem...
31 KB (4,000 words) - 19:33, 20 June 2025
mass, the first moment (normalized by total mass) is the center of mass, and the second moment is the moment of inertia. If the function is a probability...
21 KB (3,068 words) - 20:19, 25 July 2025
Standard deviation (category Statistical deviation and dispersion)
an outlier and what does not. Standard deviation may be abbreviated SD or std dev, and is most commonly represented in mathematical texts and equations...
59 KB (8,278 words) - 02:30, 10 July 2025
are the five-number summary, sometimes extended to a seven-number summary, and the associated box plot. Entries in an analysis of variance table can also...
6 KB (541 words) - 01:53, 11 January 2024

normal score, standardized variable and pull in high energy physics. Computing a z-score requires knowledge of the mean and standard deviation of the complete...
16 KB (1,936 words) - 04:48, 15 July 2025
a test of normality. It was published in 1965 by Samuel Sanford Shapiro and Martin Wilk. The Shapiro–Wilk test tests the null hypothesis that a sample...
7 KB (793 words) - 14:08, 7 July 2025
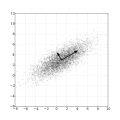
correlation coefficient exist, each with their own definition and own range of usability and characteristics. They all assume values in the range from −1...
8 KB (754 words) - 04:50, 11 June 2025
Mean (section Relationship between AM, GM, and HM)
mean is a quantity representing the "center" of a collection of numbers and is intermediate to the extreme values of the set of numbers. There are several...
17 KB (2,360 words) - 12:31, 5 August 2025

fourth spread, or H‑spread. It is defined as the difference between the 75th and 25th percentiles of the data. To calculate the IQR, the data set is divided...
10 KB (1,131 words) - 00:32, 18 July 2025