
A line chart or line graph, also known as curve chart, is a type of chart that displays information as a series of data points called 'markers' connected...
6 KB (779 words) - 11:37, 18 June 2025

represented by symbols, such as bars in a bar chart, lines in a line chart, or slices in a pie chart". A chart can represent tabular numeric data, functions...
13 KB (1,513 words) - 22:21, 24 May 2025

"transmission line chart" and other authors first used names like "reflection chart", "circle diagram of impedance", "immittance chart" or "Z-plane chart", early...
68 KB (7,969 words) - 03:12, 23 March 2025
A line break chart, also known as a three-line break chart, is a Japanese trading indicator and chart used to analyze the financial markets. Invented...
6 KB (767 words) - 17:35, 4 October 2024
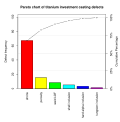
A Pareto chart is a type of chart that contains both bars and a line graph, where individual values are represented in descending order by bars, and the...
4 KB (462 words) - 16:48, 15 April 2025

Y, A, C, E, G, L, 2. The normal Snellen chart is printed with eleven lines of block letters. The first line consists of one very large letter, which...
12 KB (1,555 words) - 15:43, 24 May 2025

An area chart or area graph displays graphically quantitative data. It is based on the line chart. The area between axis and line are commonly emphasized...
3 KB (349 words) - 05:12, 16 September 2023

percent-complete shadings and a vertical "TODAY" line. Gantt charts are sometimes equated with bar charts. Gantt charts are usually created initially using an early...
18 KB (1,790 words) - 11:33, 22 April 2025

a manufacturing or other business process. It is therefore a form of line chart. Run sequence plots are an easy way to graphically summarize a univariate...
3 KB (365 words) - 12:05, 14 September 2024
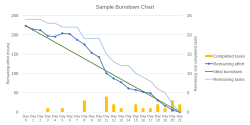
the burndown chart). Another difference is that burnup charts usually have a line representing total work. Similarly to burndown charts, the work can...
8 KB (1,010 words) - 01:27, 16 October 2024

Time series (section Overlapping charts)
Average. A time series is very frequently plotted via a run chart (which is a temporal line chart). Time series are used in statistics, signal processing...
43 KB (5,025 words) - 15:47, 14 March 2025
the line slopes upward from left to right, it indicates an increase; if downward, a decrease; and a horizontal line indicates no change. Slope charts are...
4 KB (419 words) - 06:08, 24 June 2025

chart is also known as web chart, spider chart, spider graph, spider web chart, star chart, star plot, cobweb chart, irregular polygon, polar chart,...
20 KB (2,497 words) - 06:58, 5 March 2025

A nautical chart or hydrographic chart is a graphic representation of a sea region or water body and adjacent coasts or banks. Depending on the scale...
18 KB (2,301 words) - 00:26, 14 June 2025
Styles – Fine Line" (in German). GfK Entertainment Charts. Retrieved 20 December 2019. "Official IFPI Charts Top-75 Albums Sales Chart Εβδομάδα: 03/2020"...
109 KB (7,532 words) - 16:02, 11 June 2025

the Bubbling Under Hot 100 Singles chart. "Meant to Be" was credited as Bebe Rexha featuring Florida Georgia Line when it was sent to radio. Billboard...
42 KB (1,704 words) - 01:44, 1 June 2025

Scatter plot (redirect from Scatter chart)
Denis, the defining characteristic distinguishing scatter plots from line charts is the representation of specific observations of bivariate data where...
12 KB (1,332 words) - 13:51, 9 June 2025
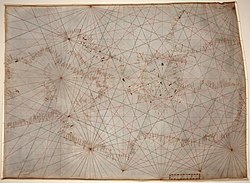
proposed include rhumb line charts, compass charts or loxodromic charts whereas modern French scholars prefer to call them nautical charts to avoid any relationship...
19 KB (2,309 words) - 12:34, 28 May 2025

A candlestick chart (also called Japanese candlestick chart or K-line) is a style of financial chart used to describe price movements of a security, derivative...
8 KB (1,013 words) - 11:45, 2 January 2025

Ogive (statistics) (redirect from Cumulative line chart)
ogive is obtained by connecting each of the points to its neighbours with line segments. Sometimes an axis for both the absolute frequency and relative...
3 KB (312 words) - 06:30, 30 May 2025

limit line. Control charts are classified into Shewhart individuals control chart (ISO 7870-2) and CUSUM(CUsUM)(or cumulative sum control chart)(ISO 7870-4)...
32 KB (3,817 words) - 15:32, 19 May 2025

movements in the price of a financial instrument over time. Each vertical line on the chart shows the price range (the highest and lowest prices) over one unit...
3 KB (359 words) - 18:18, 13 November 2024
The Official Albums Chart is the United Kingdom's industry-recognised national record chart for albums. Entries are ranked by sales and audio streaming...
49 KB (5,408 words) - 12:37, 21 June 2025

estimates of acuity as compared to other acuity charts (e.g., the Snellen chart). Each line of the LogMAR chart comprises the same number of test letters (effectively...
8 KB (872 words) - 21:03, 25 May 2025

thick line and continue the vertical line. If the price on that day is less than or equal to the previous low, then change to a thin line. Kagi Chart, Investopedia...
3 KB (486 words) - 02:39, 9 May 2025
Sparkline (redirect from Spark line)
A sparkline is a very small line chart, typically drawn without axes or coordinates. It presents the general shape of a variation (typically over time)...
8 KB (738 words) - 01:53, 27 August 2024
Cruise (song) (redirect from Cruise (Florida Georgia Line song))
"Official Singles Chart Top 100". Official Charts Company. "Florida Georgia Line Chart History (Hot 100)". Billboard. "Florida Georgia Line Chart History (Adult...
28 KB (2,537 words) - 17:20, 23 April 2025

fan chart is a chart that joins a simple line chart for observed past data, by showing ranges for possible values of future data together with a line showing...
8 KB (847 words) - 07:12, 26 March 2024
Chart.js is a free, open-source JavaScript library for data visualization, which supports eight chart types: bar, line, area, pie (doughnut), bubble, radar...
4 KB (239 words) - 16:18, 6 June 2025
An eye chart is a chart used to measure visual acuity comprising lines of optotypes in ranges of sizes. Optotypes are the letters or symbols shown on an...
15 KB (1,957 words) - 14:11, 25 January 2025