
Mathematical diagrams, such as charts and graphs, are mainly designed to convey mathematical relationships—for example, comparisons over time. A complex...
13 KB (1,582 words) - 06:43, 5 March 2025

diagram is a widely used diagram style that shows the logical relation between sets, popularized by John Venn (1834–1923) in the 1880s. The diagrams are...
31 KB (3,242 words) - 22:58, 23 June 2025

In mathematics, and especially in category theory, a commutative diagram is a diagram such that all directed paths in the diagram with the same start and...
9 KB (1,123 words) - 10:21, 23 April 2025
for creating diagrams and other data visualization List of graphical methods Mathematical diagram – Visual representation of a mathematical relationship...
16 KB (1,045 words) - 06:35, 5 March 2025
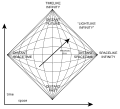
theoretical physics, a Penrose diagram (named after mathematical physicist Roger Penrose) is a two-dimensional diagram capturing the causal relations...
10 KB (1,198 words) - 15:12, 23 June 2025

In order theory, a Hasse diagram (/ˈhæsə/; German: [ˈhasə]) is a type of mathematical diagram used to represent a finite partially ordered set, in the...
11 KB (1,342 words) - 10:38, 16 December 2024

In mathematics, a Voronoi diagram is a partition of a plane into regions close to each of a given set of objects. It can be classified also as a tessellation...
46 KB (5,504 words) - 09:37, 24 June 2025
topology). Glossary of areas of mathematics List of mathematical constants List of mathematical symbols Category:Mathematical terminology Goldfeld, Dorian...
42 KB (5,513 words) - 19:18, 16 March 2025

Scatter plot (redirect from Scatter diagram)
scatter graph, scatter chart, scattergram, or scatter diagram, is a type of plot or mathematical diagram using Cartesian coordinates to display values for...
12 KB (1,332 words) - 13:51, 9 June 2025
In model theory, a branch of mathematical logic, the diagram of a structure is a simple but powerful concept for proving useful properties of a theory...
2 KB (314 words) - 04:12, 31 October 2023

In the mathematical field of Lie theory, a Dynkin diagram, named for Eugene Dynkin, is a type of graph with some edges doubled or tripled (drawn as a double...
78 KB (5,608 words) - 07:48, 7 March 2025
has the possibility of changing all the bits in the large array. Mathematical diagram Zassenhaus lemma Signal-flow graph Alan V. Oppenheim, Ronald W. Schafer...
6 KB (702 words) - 07:32, 25 May 2025
An influence diagram (ID) (also called a relevance diagram, decision diagram or a decision network) is a compact graphical and mathematical representation...
12 KB (1,467 words) - 19:29, 23 June 2025

The Hertzsprung–Russell diagram (abbreviated as H–R diagram, HR diagram or HRD) is a scatter plot of stars showing the relationship between the stars'...
23 KB (2,762 words) - 22:46, 23 April 2025
developing a mathematical model is termed mathematical modeling. Mathematical models are used in applied mathematics and in the natural sciences (such as physics...
34 KB (4,766 words) - 10:51, 20 May 2025
areas of mathematics concluded the former intuitive definitions of the basic mathematical objects were insufficient for ensuring mathematical rigour. This...
163 KB (15,943 words) - 11:16, 24 June 2025

In mathematics, particularly in dynamical systems, a bifurcation diagram shows the values visited or approached asymptotically (fixed points, periodic...
6 KB (594 words) - 05:19, 3 June 2025
Taylor diagrams are mathematical diagrams designed to graphically indicate which of several approximate representations (or models) of a system, process...
12 KB (1,478 words) - 01:15, 16 May 2025

contraction without mathematical equations. The history of an object's location through time traces out a line or curve on a spacetime diagram, referred to as...
49 KB (6,178 words) - 20:27, 25 May 2025

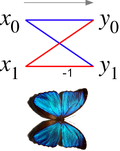
In mathematics, a chord diagram consists of a cyclic order on a set of objects, together with a one-to-one pairing (perfect matching) of those objects...
5 KB (537 words) - 00:03, 30 April 2024

A block diagram is a diagram of a system in which the principal parts or functions are represented by blocks connected by lines that show the relationships...
6 KB (742 words) - 16:11, 22 October 2023

American Mathematical Society regularly features a mathematical visualization. Geometry Center Mathematical diagram Parametric surface List of mathematical art...
9 KB (764 words) - 11:44, 24 June 2025

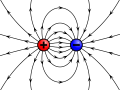
In theoretical physics, a Feynman diagram is a pictorial representation of the mathematical expressions describing the behavior and interaction of subatomic...
93 KB (15,967 words) - 09:40, 22 June 2025
In mathematics, a unitary spider diagram adds existential points to an Euler or a Venn diagram. The points indicate the existence of an attribute described...
3 KB (333 words) - 23:03, 8 December 2023
of arbitrary convention—just as it is a matter of convention in mathematical diagram to reckon positive distances towards the right hand. Electric current...
40 KB (4,998 words) - 01:03, 20 June 2025
Young tableau (redirect from Young diagram)
Journal of Mathematics. 140 (2). Mathematical Sciences Publishers: 353–396. doi:10.2140/pjm.1989.140.353. ISSN 0030-8730. For instance the skew diagram consisting...
22 KB (2,871 words) - 15:23, 6 June 2025

standard mathematical and conventional notions of a knot is that mathematical knots are closed — there are no ends to tie or untie on a mathematical knot...
23 KB (2,509 words) - 20:27, 30 April 2025

Chart (category Diagrams)
related to Chart. Diagram Table (information) Drakon-chart Exploratory data analysis Graphic organizer Information graphics Mathematical diagram Official statistics...
13 KB (1,513 words) - 22:21, 24 May 2025
Pulation square (redirect from Doolittle diagram)
In category theory, a branch of mathematics, a pulation square (also called a Doolittle diagram) is a diagram that is simultaneously a pullback square...
719 bytes (77 words) - 00:27, 13 January 2023
and a mathematical fallacy in a proof, in that a mistake in a proof leads to an invalid proof while in the best-known examples of mathematical fallacies...
21 KB (3,178 words) - 15:21, 14 May 2025