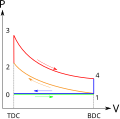
A pressure–volume diagram (or PV diagram, or volume–pressure loop) is used to describe corresponding changes in volume and pressure in a system. It is...
10 KB (1,168 words) - 13:12, 9 July 2025
on cardiac performance can be determined from the pressure vs. volume plot (pressure–volume diagram). A number of methods have been determined for measuring...
21 KB (2,725 words) - 09:22, 18 March 2025

Modified from Pressure volume diagram Mitchell, Jamie R.; Wang, Jiun Jr (2014-06-01). "Expanding application of the Wiggers diagram to teach cardiovascular...
4 KB (298 words) - 14:33, 6 December 2023
Isochoric process (redirect from Constant volume process)
Δ T {\displaystyle \Delta Q\ =mc_{\mathrm {v} }\Delta T} On a pressure volume diagram, an isochoric process appears as a straight vertical line. Its...
4 KB (527 words) - 16:48, 28 April 2025

A phase diagram in physical chemistry, engineering, mineralogy, and materials science is a type of chart used to show conditions (pressure, temperature...
22 KB (2,528 words) - 18:18, 29 July 2025
A diagram is a symbolic representation of information using visualization techniques. Diagrams have been used since prehistoric times on walls of caves...
15 KB (1,032 words) - 04:56, 17 July 2025
Carnot cycle Pressure–volume diagram Rankine cycle Saturation vapor curve Working fluid Working fluid selection "Temperature Entropy (T–s) Diagram - Thermodynamics...
3 KB (163 words) - 02:10, 8 January 2023
Carnot cycle (section The pressure–volume graph)
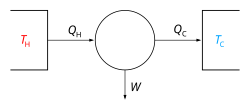
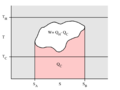
{\displaystyle Q_{H}/T_{H}} . When a Carnot cycle is plotted on a pressure–volume diagram (Figure 1), the isothermal stages follow the isotherm lines for...
25 KB (3,234 words) - 01:08, 19 July 2025
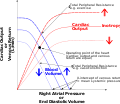
Starling used a volume-pressure diagram to construct a length-tension diagram from his data. Starling's data and associated diagrams, provided evidence...
18 KB (1,988 words) - 18:40, 24 July 2025
represented by the area under a pressure–volume diagram. If we consider the case where we have a constant pressure process then the work is simply given...
9 KB (1,167 words) - 23:52, 22 December 2024

Spirometry (redirect from Maximal pressure)
volume measurements by the spirometer needs to be complemented by pressure transducers in order to simultaneously measure the transpulmonary pressure...
30 KB (3,464 words) - 18:26, 17 July 2025
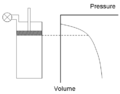
generate the diagram by fixing a board so as to move with the piston, thereby tracing the "volume" axis, while a pencil, attached to a pressure gauge, moved...
7 KB (957 words) - 19:09, 7 February 2025
reversibility, since expansion work, which can be visualized on a pressure–volume diagram as the area beneath the equilibrium curve, is different for different...
13 KB (1,539 words) - 13:56, 6 April 2025
description of what happens to a gas as it is subjected to changes of pressure, temperature, volume, addition of heat, and removal of heat. The gas that is subjected...
24 KB (4,251 words) - 12:47, 26 April 2025

Frank–Starling law Cardiac function curve Venous return curve Wiggers diagram Pressure–volume diagram Ultrasound Fractional shortening = (End-diastolic dimension...
10 KB (946 words) - 02:21, 6 April 2024

the system, such as pressure, temperature, etc. For instance, one may view the pressure–volume diagram or temperature–entropy diagram as describing part...
18 KB (2,123 words) - 04:26, 6 February 2025

Ventricle (heart) (redirect from Ventricular pressure)
end-diastolic volume (EDV), end-systolic volume (ESV), stroke volume (SV) and ejection fraction (Ef). Ventricular pressure is a measure of blood pressure within...
21 KB (2,393 words) - 18:55, 15 July 2025

entropy diagram as depicted in Figure 2. At point 1 in the diagram, the circulating refrigerant enters the compressor as a low-temperature, low-pressure saturated...
32 KB (3,690 words) - 20:39, 23 July 2025
can be viewed graphically on a pressure-volume (P-V), pressure-temperature (P-T), and temperature-entropy (T-s) diagrams. There are an infinite number...
9 KB (1,237 words) - 21:41, 3 April 2025

field diagram. It can be compared to the Ericsson cycle, where working fluid undergoes two isothermal and two isobaric processes in a pressure-volume diagram...
4 KB (455 words) - 21:46, 26 May 2025
Work (thermodynamics) (redirect from Pressure-volume work)
of the system, which always occur in conjugate pairs, for example pressure and volume or magnetic flux density and magnetization. In the International...
46 KB (7,124 words) - 01:05, 1 July 2025

the indicator be removed from service (if not). Indicator diagram, a pressure-volume diagram measured on a piston engine Metrology, the science of measurement...
19 KB (2,651 words) - 13:27, 16 February 2025

labeled "atrial pressure" and "ventricular pressure"—Wiggers diagram.) Here also may be seen the red-line tracing of "Ventricular volume", showing an increase...
20 KB (1,873 words) - 14:26, 2 June 2025

Enthalpy–entropy chart (redirect from Mollier diagram)
diagram" any thermodynamic diagram using the enthalpy as one of its axes. On the diagram, lines of constant pressure, constant temperature and volume...
7 KB (804 words) - 13:54, 9 August 2024

pressure on the water, but it is usually small and will be neglected in the following discussion. Referring to the diagram on the right, a pressure tank...
6 KB (878 words) - 23:03, 6 June 2025

Mixed/dual cycle (redirect from Limited-pressure cycle)
constant volume. Process 3-4: Addition of heat at constant pressure. Process 4-5: Isentropic expansion. Process 5-1: Rejection of heat at constant volume. Cornel...
2 KB (211 words) - 15:49, 28 March 2022
Pressure–volume loops are widely used in basic and preclinical research. Left ventricular PV loops are considered to be the gold standard for hemodynamic...
10 KB (1,343 words) - 17:05, 26 May 2025

: 445 Gauge pressure (also spelled gage pressure) is the pressure relative to the ambient pressure. Various units are used to express pressure. Some of these...
46 KB (5,760 words) - 16:09, 21 May 2025
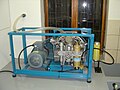
A compressor is a mechanical device that increases the pressure of a gas by reducing its volume. An air compressor is a specific type of gas compressor...
49 KB (6,855 words) - 06:43, 23 June 2025