
plot, sometimes to a more general class of plots, and sometimes to the less commonly used P–P plot. The probability plot correlation coefficient plot...
21 KB (2,518 words) - 10:49, 4 July 2025
The probability plot correlation coefficient (PPCC) plot is a graphical technique for identifying the shape parameter for a distributional family that...
6 KB (872 words) - 22:01, 22 September 2020
List of statistics articles (redirect from Probability Applications)
error Probability of precipitation Probability plot Probability plot correlation coefficient – redirects to Q–Q plot Probability plot correlation coefficient...
87 KB (8,280 words) - 18:37, 30 July 2025
plot, "quantile–quantile" plot Normal probability plot, a Q–Q plot against the standard normal distribution Probability plot correlation coefficient Probability...
420 bytes (81 words) - 02:47, 21 June 2025
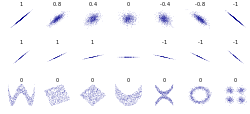
In statistics, the Pearson correlation coefficient (PCC) is a correlation coefficient that measures linear correlation between two sets of data. It is...
58 KB (8,398 words) - 00:35, 24 June 2025
A correlation coefficient is a numerical measure of some type of linear correlation, meaning a statistical relationship between two variables. The variables...
8 KB (754 words) - 04:50, 11 June 2025

In statistics, Spearman's rank correlation coefficient or Spearman's ρ is a number ranging from -1 to 1 that indicates how strongly two sets of ranks...
33 KB (4,320 words) - 00:47, 18 June 2025

distribution is more common than looking at a box plot, it can be useful to compare the box plot against the probability density function (theoretical histogram)...
20 KB (2,992 words) - 09:09, 23 July 2025
In statistics, the Kendall rank correlation coefficient, commonly referred to as Kendall's τ coefficient (after the Greek letter τ, tau), is a statistic...
32 KB (5,433 words) - 07:33, 3 July 2025

A violin plot is a statistical graphic for comparing probability distributions. It is similar to a box plot, with the addition of a rotated kernel density...
4 KB (483 words) - 20:00, 9 July 2025
product-moment correlation coefficient (PPMCC), or "Pearson's correlation coefficient", commonly called simply "the correlation coefficient". It is obtained...
39 KB (5,359 words) - 04:50, 11 June 2025
np-chart p-chart Pie chart Probability plot Normal probability plot Poincaré plot Probability plot correlation coefficient plot Q–Q plot Rankit Run chart Seasonal...
4 KB (335 words) - 04:31, 6 November 2024
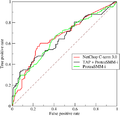
Receiver operating characteristic (redirect from ROC plot)
from the real class) and their geometric mean is the Matthews correlation coefficient.[citation needed] Whereas ROC AUC varies between 0 and 1 — with...
62 KB (7,929 words) - 05:43, 2 July 2025

scatter plot and many other statistical tools to pursue a scientific basis for eugenics. When, in 1886, Galton published a scatter plot and correlation ellipse...
13 KB (1,408 words) - 16:06, 4 August 2025
binary variables. In machine learning, it is known as the Matthews correlation coefficient (MCC) and used as a measure of the quality of binary (two-class)...
25 KB (3,802 words) - 19:09, 25 July 2025

A ridgeline plot (also known as a joyplot) is a series of line plots that are combined by vertical stacking to allow the easy visualization of changes...
2 KB (161 words) - 15:06, 1 June 2025
In probability theory and statistics, the coefficient of variation (CV), also known as normalized root-mean-square deviation (NRMSD), percent RMS, and...
30 KB (4,017 words) - 13:36, 17 April 2025
correlated in the population). An example is the Pearson product-moment correlation coefficient, which is found by dividing the covariance of the two variables...
35 KB (4,051 words) - 21:58, 23 January 2025

to the kernel density. Sina plots are similar to violin plots, but while violin plots depict kernel density, sina plots depict the points themselves...
3 KB (315 words) - 00:17, 20 June 2025

Autocorrelation (redirect from Serial correlation coefficient)
normalize the autocovariance function to get a time-dependent Pearson correlation coefficient. However, in other disciplines (e.g. engineering) the normalization...
40 KB (5,833 words) - 00:42, 20 June 2025
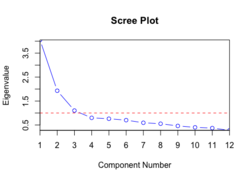
multivariate statistics, a scree plot is a line plot of the eigenvalues of factors or principal components in an analysis. The scree plot is used to determine the...
4 KB (430 words) - 11:15, 24 June 2025
Contingency table (redirect from Contingency coefficient)
tetrachoric correlation coefficient but it is only applicable to 2 × 2 tables. Polychoric correlation is an extension of the tetrachoric correlation to tables...
15 KB (1,965 words) - 02:49, 31 July 2025

recall), or the Matthews correlation coefficient, which is a geometric mean of the chance-corrected variants: the regression coefficients Informedness (DeltaP')...
23 KB (3,747 words) - 21:15, 17 July 2025

a volcano plot is a type of scatter-plot that is used to quickly identify changes in large data sets composed of replicate data. It plots significance...
6 KB (756 words) - 18:50, 18 June 2025
Tail dependence (category Covariance and correlation)
In probability theory, the tail dependence of a pair of random variables is a measure of their comovements in the tails of the distributions. The concept...
2 KB (275 words) - 08:59, 15 January 2024
program? A rank correlation coefficient can measure that relationship, and the measure of significance of the rank correlation coefficient can show whether...
14 KB (2,562 words) - 09:39, 23 July 2025
In probability theory and statistics, partial correlation measures the degree of association between two random variables, with the effect of a set of...
24 KB (3,782 words) - 08:17, 28 March 2025
joint-probability of agreement, such as Cohen's kappa, Scott's pi and Fleiss' kappa; or inter-rater correlation, concordance correlation coefficient, intra-class...
19 KB (2,480 words) - 14:11, 26 May 2025

Wikimedia Commons has media related to Forest plots. A forest plot, also known as a blobbogram, is a graphical display of estimated results from a number...
10 KB (1,276 words) - 03:26, 3 March 2025

Bivariate analysis (section Bivariate Correlation)
Pearson product–moment correlation coefficient (also referred to as the Pearson correlation coefficient or correlation coefficient), which is usually denoted...
8 KB (946 words) - 06:19, 12 January 2025