
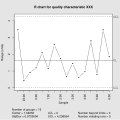
Control charts are graphical plots used in production control to determine whether quality and manufacturing processes are being controlled under stable...
32 KB (3,817 words) - 15:32, 19 May 2025
lawsuit in March 2014 by Media Control AG, Media Control GfK International had to change its name. Dissemination of the charts is conducted by various media...
9 KB (904 words) - 14:04, 15 April 2025
management. A control chart is a more specific kind of run chart. The control chart is one of the seven basic tools of quality control, which also include...
10 KB (1,261 words) - 01:28, 22 July 2025

some of them: Control chart Greninger chart Heatmap Natal chart Nomogram Pareto chart Run chart Strip chart Structure chart Vowel chart One more example:...
13 KB (1,513 words) - 22:21, 24 May 2025

In statistical quality control, the individual/moving-range chart is a type of control chart used to monitor variables data from a business or industrial...
10 KB (1,166 words) - 15:43, 12 June 2025
Distribution-free (nonparametric) control charts are one of the most important tools of statistical process monitoring and control. Implementation techniques...
4 KB (503 words) - 23:26, 30 December 2024
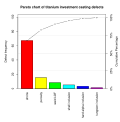
purpose of the Pareto chart is to highlight the most important among a (typically large) set of factors. In quality control, Pareto charts are useful to find...
4 KB (462 words) - 11:11, 8 July 2025

pie chart (or a circle chart) is a circular statistical graphic which is divided into slices to illustrate numerical proportion. In a pie chart, the...
22 KB (2,339 words) - 19:01, 12 July 2025
2025. "Teddy Swims – Lose Control". Swiss Singles Chart. Retrieved February 4, 2024. Top Radio Hits Ukraine Weekly Chart. TopHit. June 28, 2024. Retrieved...
56 KB (3,801 words) - 03:28, 2 August 2025
version of Raf's "Self Control", which was a commercial success, peaking at number four on the US Billboard Hot 100 and topping the charts in Canada and several...
19 KB (1,211 words) - 04:32, 5 June 2025

specifications) output can be measured. Key tools used in SPC include run charts, control charts, a focus on continuous improvement, and the design of experiments...
21 KB (2,621 words) - 02:45, 24 June 2025

Flowchart (redirect from Flow-chart)
as "cross-functional" when the chart is divided into different vertical or horizontal parts, to describe the control of different organizational units...
23 KB (1,764 words) - 03:19, 22 July 2025

A bar chart or bar graph is a chart or graph that presents categorical data with rectangular bars with heights or lengths proportional to the values that...
7 KB (811 words) - 00:33, 15 July 2025
in the Swiss charts), with Branigan's rendition becoming the most successful single of the year in Germany and Switzerland. "Self Control" has become one...
47 KB (3,992 words) - 04:26, 11 July 2025
CUSUM (redirect from Cumulative sum control chart)
In statistical quality control, the CUSUM (or cumulative sum control chart) is a sequential analysis technique developed by E. S. Page of the University...
7 KB (726 words) - 20:23, 8 December 2024

In statistical quality control, the p-chart is a type of control chart used to monitor the proportion of nonconforming units in a sample, where the sample...
8 KB (760 words) - 08:10, 9 February 2024
In statistical quality control, the regression control chart allows for monitoring a change in a process where two or more variables are correlated. The...
1 KB (133 words) - 00:16, 15 April 2023

chart is also known as web chart, spider chart, spider graph, spider web chart, star chart, star plot, cobweb chart, irregular polygon, polar chart,...
20 KB (2,505 words) - 11:37, 21 July 2025

In statistical quality control, an EWMA chart (or exponentially weighted moving average chart) is a type of control chart used to monitor either variables...
6 KB (684 words) - 23:34, 30 December 2024
A target chart, also known as a difference chart, deviation chart, or nominal chart is a control chart that plots the deviation from the nominal value...
936 bytes (79 words) - 21:30, 14 March 2025
Seven basic tools of quality (redirect from Seven Basic Tools of Quality Control)
Cause-and-effect diagram Check sheet Control chart Histogram Pareto chart Scatter diagram Flow chart Run chart The seven basic tools of quality are a...
7 KB (752 words) - 17:45, 6 April 2025

A Gantt chart is a bar chart that illustrates a project schedule. It was designed and popularized by Henry Gantt around the years 1910–1915. Modern Gantt...
18 KB (1,798 words) - 16:43, 28 July 2025
In statistical process control (SPC), the x ¯ {\displaystyle {\bar {x}}} and R chart, also known as an averages and range chart is a type of scheme, popularly...
8 KB (775 words) - 04:44, 20 July 2025
Western Electric rules (category Quality control tools)
control for detecting out-of-control or non-random conditions on control charts. Locations of the observations relative to the control chart control limits...
8 KB (659 words) - 11:02, 3 November 2023

Nelson rules (category Quality control tools)
Technology in an article by Lloyd S. Nelson. The rules are applied to a control chart on which the magnitude of some variable is plotted against time. The...
5 KB (354 words) - 15:08, 25 June 2025
A record chart, in the music industry, also called a music chart, is a ranking of recorded music according to certain criteria during a given period....
9 KB (1,225 words) - 16:17, 20 July 2025
Glass Houses (album) (section Charts)
Billy Joel" (in German). Media Control. Retrieved November 1, 2011.[dead link] * Zimbabwe. Kimberley, C. Zimbabwe: albums chart book. Harare: C. Kimberley...
25 KB (1,597 words) - 10:24, 8 August 2025
A scientific control is an experiment or observation designed to minimize the effects of variables other than the independent variable (i.e. confounding...
25 KB (3,157 words) - 15:20, 24 June 2025

lot of government control in both the personal and economic areas. Different versions of the chart as well as Nolan's original chart use terms such as...
20 KB (2,224 words) - 19:43, 9 July 2025

controlled trial (or randomized control trial; RCT) is a form of scientific experiment used to control factors not under direct experimental control....
89 KB (10,229 words) - 16:13, 5 August 2025