
Wikimedia Commons has media related to Forest plots. A forest plot, also known as a blobbogram, is a graphical display of estimated results from a number...
10 KB (1,276 words) - 03:26, 3 March 2025
ability to visually discern publication bias from funnel plots. Galbraith plot Forest plot Systematic review R. J. Light; D. B. Pillemer (1984). Summing...
7 KB (751 words) - 19:47, 24 May 2025

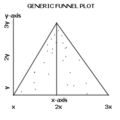
epidemiology) and forest plots are often used in presenting the results of such studies also. Funnel plot Dot plot (statistics) Forest plot Galbraith plot : In statistics...
20 KB (2,606 words) - 05:30, 21 July 2025

In descriptive statistics, a box plot or boxplot is a method for demonstrating graphically the locality, spread and skewness groups of numerical data through...
20 KB (2,992 words) - 09:09, 23 July 2025

statistics, a Q–Q plot (quantile–quantile plot) is a probability plot, a graphical method for comparing two probability distributions by plotting their quantiles...
21 KB (2,518 words) - 10:49, 4 July 2025

A violin plot is a statistical graphic for comparing probability distributions. It is similar to a box plot, with the addition of a rotated kernel density...
4 KB (483 words) - 20:00, 9 July 2025

a volcano plot is a type of scatter-plot that is used to quickly identify changes in large data sets composed of replicate data. It plots significance...
6 KB (756 words) - 18:50, 18 June 2025

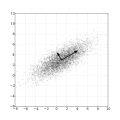
A scatter plot, also called a scatterplot, scatter graph, scatter chart, scattergram, or scatter diagram, is a type of plot or mathematical diagram using...
12 KB (1,332 words) - 17:19, 19 July 2025
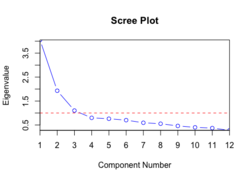
multivariate statistics, a scree plot is a line plot of the eigenvalues of factors or principal components in an analysis. The scree plot is used to determine the...
4 KB (430 words) - 11:15, 24 June 2025

heterogeneity in a meta-analysis, as an alternative or supplement to a forest plot. A Galbraith plot is produced by first calculating the standardized estimates...
4 KB (468 words) - 11:51, 3 July 2025

A ridgeline plot (also known as a joyplot) is a series of line plots that are combined by vertical stacking to allow the easy visualization of changes...
2 KB (161 words) - 15:06, 1 June 2025

The 20 July plot, sometimes referred to as Operation Valkyrie, was a failed attempt to assassinate Adolf Hitler, the dictator of Germany, and overthrow...
89 KB (10,316 words) - 21:42, 20 July 2025
Autocorrelation plot Bar chart Biplot Box plot Bullet graph Chernoff faces Control chart Fan chart Forest plot Funnel plot Galbraith plot Histogram Mosaic plot Multidimensional...
4 KB (335 words) - 04:31, 6 November 2024
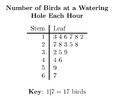
Stem-and-leaf display (redirect from Stem-and-leaf plot)
A stem-and-leaf display or stem-and-leaf plot is a device for presenting quantitative data in a graphical format, similar to a histogram, to assist in...
8 KB (1,090 words) - 08:55, 1 July 2025


to the kernel density. Sina plots are similar to violin plots, but while violin plots depict kernel density, sina plots depict the points themselves...
3 KB (315 words) - 00:17, 20 June 2025
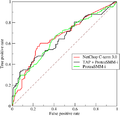
Receiver operating characteristic (redirect from ROC plot)
A receiver operating characteristic curve, or ROC curve, is a graphical plot that illustrates the performance of a binary classifier model (can be used...
62 KB (7,929 words) - 05:43, 2 July 2025

"meta-analytic thinking". The results of a meta-analysis are often shown in a forest plot. Results from studies are combined using different approaches. One approach...
102 KB (11,910 words) - 14:03, 4 July 2025
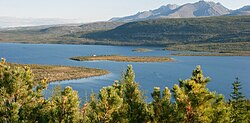
Taiga (redirect from Boreal forest)
forest or snow forest, is a biome characterized by coniferous forests consisting mostly of pines, spruces, and larches. The taiga, or boreal forest,...
82 KB (9,449 words) - 08:19, 22 July 2025

Radar chart (redirect from Star plot)
star chart, star plot, cobweb chart, irregular polygon, polar chart, or Kiviat diagram. It is equivalent to a parallel coordinates plot, with the axes arranged...
20 KB (2,505 words) - 11:37, 21 July 2025

headquarters, a series of concrete bunkers and shelters located deep in the forest of East Prussia, not far from the location of the World War I Battle of...
25 KB (441 words) - 21:17, 24 July 2025
Restricted randomization (redirect from Strip-plot design)
variation or restricted randomization discussed on this page are split-plot and strip-plot designs. The objective of an experiment with this type of sampling...
23 KB (3,310 words) - 04:58, 6 September 2022

(2022). Her most recent novel, The Partner Plot (2024), was Good Morning America's Buzz Pick of February 2024. Forest earned a writing arts degree from Rowan...
6 KB (475 words) - 16:14, 8 December 2024

Site A (redirect from Site A/Plot M Disposal Site)
to the public forest agency in 1956, but Site A, and a nearby site formerly used for the disposal of low-level radioactive waste, Plot M, continue to...
8 KB (1,020 words) - 01:51, 12 July 2025
The "doctors' plot" (Russian: дело врачей, romanized: delo vrachey, lit. 'doctors' case') was a Soviet state-sponsored anti-intellectual and antisemitic...
33 KB (3,848 words) - 03:25, 30 June 2025
The Dark Forest (Chinese: 黑暗森林) is a 2008 science fiction novel by the Chinese writer Liu Cixin. It is the sequel to the Hugo Award-winning novel The Three-Body...
12 KB (1,330 words) - 13:01, 17 July 2025

Karura Forest is an urban forest in Nairobi, the capital of Kenya. It is the second largest urban forest in the world after the Tijuca Forest in Rio de...
31 KB (3,205 words) - 02:19, 21 July 2025
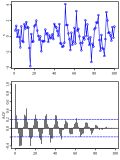
Correlogram (redirect from Autocorrelation plot)
chart of correlation statistics. For example, in time series analysis, a plot of the sample autocorrelations r h {\displaystyle r_{h}\,} versus h {\displaystyle...
10 KB (1,389 words) - 13:59, 18 July 2025
uncorrelated. Many studies use the first two principal components in order to plot the data in two dimensions and to visually identify clusters of closely related...
117 KB (14,851 words) - 14:54, 21 July 2025
Back to the Forest (のどか森の動物大作戦, Nodoka Mori no Doubutsu Daisakusen; lit. The Great Plot of the Animals of Placid Forest) is a Japanese anime television...
8 KB (1,089 words) - 23:20, 16 November 2024