An influence diagram (ID) (also called a relevance diagram, decision diagram or a decision network) is a compact graphical and mathematical representation...
12 KB (1,467 words) - 19:40, 6 September 2024
Influence Diagrams Approach (IDA) is a technique used in the field of Human reliability Assessment (HRA), for the purposes of evaluating the probability...
10 KB (1,580 words) - 19:32, 20 October 2024
Decision tree (section Influence diagram)
rules. In decision analysis, a decision tree and the closely related influence diagram are used as a visual and analytical decision support tool, where the...
26 KB (3,463 words) - 08:52, 27 March 2025
communicating quantitative decision models. It combines hierarchical influence diagrams for visual creation and view of models, intelligent arrays for working...
34 KB (3,782 words) - 22:22, 4 May 2025
and influence diagrams are most commonly used in representing and solving decision situations as well as associated VoC calculation. The influence diagram...
10 KB (1,431 words) - 20:48, 19 February 2025

In mathematics, a Voronoi diagram is a partition of a plane into regions close to each of a given set of objects. It can be classified also as a tessellation...
46 KB (5,504 words) - 02:43, 25 March 2025
in his honor. He was also instrumental in the development of the Influence diagram for the graphical analysis of decision situations. In 1980 Howard...
7 KB (641 words) - 16:18, 18 March 2025
quantitative methods. The framing process may lead to the development of an influence diagram or decision tree. These are commonly used graphical representations...
28 KB (3,234 words) - 17:22, 26 January 2025
In computer science, a binary decision diagram (BDD) or branching program is a data structure that is used to represent a Boolean function. On a more...
24 KB (3,067 words) - 22:56, 20 December 2024
staying robust and formally verifiable). RDDL (Relational Dynamic influence Diagram Language) was the official language of the uncertainty track of the...
30 KB (3,469 words) - 00:04, 7 January 2025
that always returns the same value that was used as its argument Influence diagram, a graphical and mathematical representation of a decision situation...
6 KB (777 words) - 15:48, 30 April 2025

Entity–relationship model (redirect from ER diagram)
"primary keys". Diagrams created to represent attributes as well as entities and relationships may be called entity-attribute-relationship diagrams, rather than...
34 KB (4,337 words) - 15:09, 21 April 2025

edges. Another type of graph with a similar causal structure is an influence diagram, the vertices of which represent either decisions to be made or unknown...
45 KB (5,646 words) - 20:41, 12 May 2025
represent and solve decision problems under uncertainty are called influence diagrams. Formally, Bayesian networks are directed acyclic graphs (DAGs) whose...
53 KB (6,630 words) - 21:10, 4 April 2025

A system context diagram in engineering is a diagram that defines the boundary between the system, or part of a system, and its environment, showing the...
8 KB (959 words) - 20:47, 9 March 2025
In coordination chemistry, Tanabe–Sugano diagrams are used to predict absorptions in the ultraviolet (UV), visible and infrared (IR) electromagnetic spectrum...
21 KB (2,288 words) - 18:18, 4 November 2024
locality suitable for discussion of quantum mechanics is illustrated in the diagram. A particle is created in one location, then split and measured in two...
23 KB (2,821 words) - 00:44, 3 May 2025
Decision-making Decision model Decision theory Decision tree Decision support Influence diagram Ronald A. Howard, "Decision Analysis: Practice and Promise", Management...
8 KB (1,124 words) - 17:15, 5 December 2024

point on the structure. An influence line for a function differs from a shear, axial, or bending moment diagram. Influence lines can be generated by independently...
18 KB (2,699 words) - 02:59, 23 August 2024
handling multidimensional data, linear and non-linear optimization. Uses influence diagrams to define, navigate, and document models. AnyLogic Proprietary, commercial...
10 KB (85 words) - 13:51, 9 May 2025

to help solve a murder mystery. Corporate strategy Futures studies Influence diagrams Market research Scenario analysis Scenario planning Socio-technical...
8 KB (813 words) - 08:24, 23 April 2025
analysis and drama theory morphological analysis and various forms of influence diagrams cognitive mapping strategic choice robustness analysis The International...
52 KB (5,662 words) - 23:03, 8 April 2025

In mathematics, trace diagrams are a graphical means of performing computations in linear and multilinear algebra. They can be represented as (slightly...
9 KB (1,244 words) - 19:37, 2 October 2021
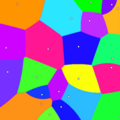
weighted Voronoi diagram in n dimensions is a generalization of a Voronoi diagram. The Voronoi cells in a weighted Voronoi diagram are defined in terms...
3 KB (350 words) - 08:01, 13 August 2024
which case the spaces X and D are each vector spaces. The diagram at right is an influence diagram for deciding how early the decision maker should leave...
12 KB (1,850 words) - 19:10, 13 May 2025
represent and solve decision problems under uncertainty are called influence diagrams. A Gaussian process is a stochastic process in which every finite...
140 KB (15,540 words) - 15:58, 12 May 2025
{\displaystyle n} subjects. This question is answered by the EVSI. The diagram shows an influence diagram for computing the EVSI in this example. The model classifies...
8 KB (1,441 words) - 19:09, 13 May 2025

students, and the general public. The first ribbon diagrams, hand-drawn by Jane S. Richardson in 1980 (influenced by earlier individual illustrations), were the...
12 KB (1,087 words) - 18:27, 1 February 2025

general modeling language and interactive development environment. Its influence diagrams enable users to formulate problems as graphs with nodes for decision...
61 KB (6,690 words) - 17:57, 6 May 2025

of the polar area diagram, also called the Nightingale rose diagram, which is equivalent to a modern circular histogram. This diagram is still regularly...
128 KB (13,369 words) - 20:34, 13 May 2025