A spectrogram is a visual representation of the spectrum of frequencies of a signal as it varies with time. When applied to an audio signal, spectrograms...
20 KB (2,187 words) - 12:56, 6 July 2025
is used. Spectrogram is one of the most popular time-frequency representation, and generalized spectrogram, also called "two-window spectrogram", is the...
4 KB (803 words) - 16:52, 18 September 2023
is moving ice in Antarctica. Sound spectrograms of vibrations caused by friction closely resemble the spectrogram of the Slow Down. This suggests the...
13 KB (1,451 words) - 15:39, 27 June 2025
Glossary of astronomy (redirect from Coudé spectrogram)
This glossary of astronomy is a list of definitions of terms and concepts relevant to astronomy and cosmology, their sub-disciplines, and related fields...
176 KB (20,291 words) - 10:58, 4 July 2025

is a technique for sharpening a time-frequency representation (e.g. spectrogram or the short-time Fourier transform) by mapping the data to time-frequency...
25 KB (4,004 words) - 00:53, 6 December 2024
Acoustic fingerprint (section Spectrogram)
creating a time-frequency graph called a spectrogram. Any piece of audio can be translated into a spectrogram. Each piece of audio is split into segments...
6 KB (675 words) - 16:27, 22 December 2024
Windowlicker (section Spectrogram)
allows the user to insert a digital image as the spectrogram. MetaSynth will then convert the spectrogram to digital sound and "play" the picture. According...
24 KB (2,236 words) - 17:14, 6 July 2025
cryoseism (also known as an ice quake). Numerous ice quakes share similar spectrograms with Bloop, as well as the amplitude necessary to detect them despite...
11 KB (1,230 words) - 06:40, 12 July 2025

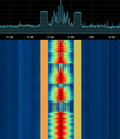
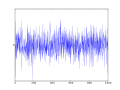
French speaking persons were heard. In January 2022, various signals with spectrogram-encoded images, visible through a spectrum analyzer, were broadcast on...
30 KB (2,816 words) - 10:53, 4 July 2025
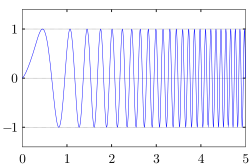
Spectrogram of a linear chirp. The spectrogram plot demonstrates the linear rate of change in frequency as a function of time, in this case from 0 to 7...
16 KB (2,305 words) - 19:29, 28 June 2025

from the Sea". oceanexplorer.noaa.gov. Retrieved 2024-09-15. "Seismic spectrograms - PMEL Acoustics Program". www.pmel.noaa.gov. Retrieved 2024-09-16. "Do...
7 KB (709 words) - 23:48, 21 May 2025
converting to an 80-channel log-magnitude Mel spectrogram using 25 ms windows with a 10 ms stride. The spectrogram is then normalized to a [-1, 1] range with...
16 KB (1,659 words) - 22:46, 13 July 2025

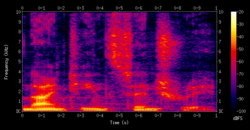
This Fourier transform was computed using SourceForge In acoustics, a spectrogram is a visual representation of the frequency spectrum of sound as a function...
22 KB (2,733 words) - 20:30, 23 May 2025

loudness corresponds to brightness; pitch corresponds to the y-shift of the spectrogram. The Acoustical Society of America (ASA) Acoustical Terminology definition...
19 KB (2,252 words) - 00:04, 11 June 2025
the spectrogram can be configured. There are three types of spectrogram: generic spectrogram melodic-range spectrogram peak-frequency spectrogram Generic...
6 KB (496 words) - 10:47, 17 January 2025

Windows. The software supports formant analysis, pitch extraction, and spectrogram visualization, along with speech synthesis, including articulatory synthesis...
4 KB (239 words) - 07:26, 5 May 2025
usually plots the changing spectra as a function of time, known as a spectrogram or waterfall plot, such as commonly used in software defined radio (SDR)...
22 KB (4,055 words) - 09:25, 3 March 2025

acoustic resonances of the vocal tract which show up as dark bands on a spectrogram. The vocal tract acts as a resonant cavity, and the position of the jaw...
59 KB (7,308 words) - 00:27, 19 June 2025
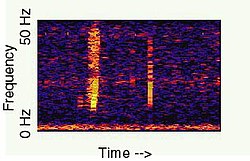
appear as a single high-amplitude spike in the time-domain data. On a spectrogram, a sferic appears as a vertical stripe (reflecting its broadband and...
19 KB (2,407 words) - 19:14, 8 December 2023

visualization and measurement of acoustic signals and their properties. The spectrogram produced by such an instrument is a graphical display of the time varying...
41 KB (4,370 words) - 12:31, 26 June 2025
based on an audio fingerprint based on a time-frequency graph called a spectrogram. Shazam stores a catalogue of audio fingerprints in a database. The user...
6 KB (842 words) - 18:44, 5 December 2024

impression of several tones being sung at once. Spectrograms may be used to visualise formants. In spectrograms, it can be hard to distinguish formants from...
17 KB (2,021 words) - 20:14, 9 July 2025
such as rotational speed. Waterfall plots are also often used to depict spectrograms or cumulative spectral decay[definition needed] (CSD). The results of...
3 KB (176 words) - 10:52, 12 July 2025

years before returning with a video titled "º" which featured audio of a spectrogram featuring the clowns with bold text on the top that read "WE ARE IN A...
8 KB (755 words) - 21:59, 22 January 2025

characterized by different formant structures, that are visible in a spectrogram of the recorded sound wave. Formants are the amplitude peaks in the frequency...
139 KB (16,424 words) - 00:07, 15 July 2025
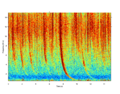
Spectrogram of pink noise (left) and white noise (right), shown with linear frequency axis (vertical) versus time axis (horizontal)...
30 KB (4,037 words) - 08:39, 28 June 2025

The spectrogram of the human voice reveals its rich harmonic content....
24 KB (2,922 words) - 17:47, 3 July 2025
Internet trend. On May 16, 2018, a report in The New York Times noted a spectrogram analysis confirmed how the extra sounds for "yanny" can be graphed in...
17 KB (1,652 words) - 02:58, 30 June 2025
latency. The encoder calculates a log mel spectrogram and performs vector quantization to store the spectrogram in a data stream. The decoder is a WaveNet...
7 KB (724 words) - 23:52, 8 December 2024