
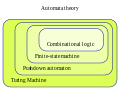
A state diagram is used in computer science and related fields to describe the behavior of systems. State diagrams require that the system is composed...
15 KB (1,958 words) - 10:30, 26 March 2025

In software engineering, a class diagram in the Unified Modeling Language (UML) is a type of static structure diagram that describes the structure of a...
19 KB (2,099 words) - 07:40, 5 March 2025
A diagram is a symbolic representation of information using visualization techniques. Diagrams have been used since prehistoric times on walls of caves...
16 KB (1,045 words) - 06:35, 5 March 2025

graph Data flow diagram Drakon-chart Event-driven process chain List of UML tools Pseudocode State diagram Flowchart Activity cycle diagram "Activities"...
5 KB (582 words) - 22:25, 25 March 2025

Flow diagram is a diagram representing a flow or set of dynamic relationships in a system. The term flow diagram is also used as a synonym for flowchart...
4 KB (537 words) - 10:24, 22 February 2025
next state along with other outputs. A state-transition table is one of many ways to specify a finite-state machine. Other ways include a state diagram. State-transition...
9 KB (781 words) - 18:39, 10 October 2024

In software engineering, a sequence diagram shows process interactions arranged in time sequence. This diagram depicts the processes and objects involved...
7 KB (909 words) - 07:29, 5 March 2025
each input: The turnstile state machine can also be represented by a directed graph called a state diagram (above). Each state is represented by a node...
40 KB (4,529 words) - 09:20, 27 May 2025

A deployment diagram "specifies constructs that can be used to define the execution architecture of systems and the assignment of software artifacts to...
2 KB (242 words) - 15:18, 22 November 2024

In molecular spectroscopy, a Jablonski diagram is a diagram that illustrates the electronic states and often the vibrational levels of a molecule, and...
4 KB (457 words) - 21:09, 29 May 2025

In Unified Modeling Language (UML), a component diagram depicts how components are wired together to form larger components or software systems. They...
4 KB (371 words) - 03:47, 3 June 2024

Sankey diagrams are a data visualisation technique or flow diagram that emphasizes flow/movement/change from one state to another or one time to another...
7 KB (730 words) - 18:43, 20 May 2025
the traditional state diagrams. The UML state diagrams are directed graphs in which nodes denote states and connectors denote state transitions. For...
43 KB (6,033 words) - 02:35, 26 December 2024

In object-oriented programming, an object diagram in the Unified Modeling Language (UML) is a diagram that shows a complete or partial view of the structure...
7 KB (779 words) - 12:15, 1 January 2025
Unified Modeling Language (redirect from UML Diagram)
many types of diagrams which can be roughly divided into three main groups: behavior diagrams, interaction diagrams, and structure diagrams. The creation...
27 KB (2,974 words) - 11:16, 10 May 2025

In theoretical physics, a Feynman diagram is a pictorial representation of the mathematical expressions describing the behavior and interaction of subatomic...
93 KB (15,967 words) - 18:03, 26 May 2025

types of interaction diagrams: Sequence diagram Communication diagram Interaction overview diagram Timing diagram A Communication diagram models the interactions...
3 KB (271 words) - 01:18, 15 November 2024

A circuit diagram (or: wiring diagram, electrical diagram, elementary diagram, electronic schematic) is a graphical representation of an electrical circuit...
12 KB (1,307 words) - 11:08, 20 January 2024

Siteswap (section State diagrams)
pattern can be described by stating how many throws later each ball is caught. For instance, on the first throw in the diagram, the purple ball is thrown...
29 KB (4,012 words) - 11:16, 14 February 2025
Mealy machine (redirect from Mealy state machine)
more logic may be necessary to decode state into outputs—more gate delays after clock edge. The state diagram for a Mealy machine associates an output...
7 KB (1,010 words) - 06:30, 14 April 2025

The Hertzsprung–Russell diagram (abbreviated as H–R diagram, HR diagram or HRD) is a scatter plot of stars showing the relationship between the stars'...
23 KB (2,762 words) - 22:46, 23 April 2025
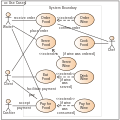
A use case diagram is a graphical depiction of a user's possible interactions with a system. A use case diagram shows various use cases and different types...
4 KB (436 words) - 23:02, 4 November 2024

A package diagram in the Unified Modeling Language depicts "specializations for Models and for Profiles that organize extensions to UML." In addition...
5 KB (549 words) - 21:39, 19 March 2025

Deterministic finite automaton (redirect from Deterministic finite state automaton)
1943. The figure illustrates a deterministic finite automaton using a state diagram. In this example automaton, there are three states: S0, S1, and S2 (denoted...
29 KB (3,736 words) - 06:30, 14 April 2025

A phase diagram in physical chemistry, engineering, mineralogy, and materials science is a type of chart used to show conditions (pressure, temperature...
22 KB (2,517 words) - 20:50, 4 March 2025

spacetime diagram is a graphical illustration of locations in space at various times, especially in the special theory of relativity. Spacetime diagrams can...
49 KB (6,178 words) - 20:27, 25 May 2025

provides to end-users. UML diagrams are used to represent the logical view, and include class diagrams, and state diagrams. Process view: The process...
4 KB (474 words) - 00:37, 11 December 2024
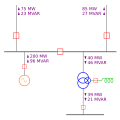
In power engineering, a single-line diagram (SLD), also sometimes called one-line diagram, is a simplest symbolic representation of an electric power...
7 KB (800 words) - 04:55, 22 April 2025
since 1970. It is used to represent diagrams of digital integrated circuits. The ASM diagram is like a state diagram but more structured and, thus, easier...
17 KB (1,952 words) - 20:01, 25 May 2025
stored. The state of the block is changed according to the State Diagram of the protocol used. (Refer image above for MESI state diagram). The bus has...
20 KB (2,543 words) - 00:12, 4 March 2025