
Bland–Altman plot Box plot Carpet plot Phase path of Duffing oscillator plotted as a comet plot Animated marker over a 2D plot Contour plot Logarithmic plot Parallel...
19 KB (2,555 words) - 00:27, 24 April 2024
Woodford The Plot (novel), a 2021 mystery by Jean Hanff Korelitz Plot (graphics), a graphical technique for representing a data set Plot (radar), a graphic...
2 KB (266 words) - 17:22, 11 June 2024

statistics, a Q–Q plot (quantile–quantile plot) is a probability plot, a graphical method for comparing two probability distributions by plotting their quantiles...
21 KB (2,478 words) - 15:40, 5 April 2024

A violin plot is a statistical graphic for comparing probability distributions. It is similar to a box plot, with the addition of a rotated kernel density...
4 KB (483 words) - 01:03, 14 May 2024

In descriptive statistics, a box plot or boxplot is a method for demonstrating graphically the locality, spread and skewness groups of numerical data through...
20 KB (2,981 words) - 22:01, 21 May 2024
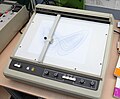
A plotter is a machine that produces vector graphics drawings. Plotters draw lines on paper using a pen, or in some applications, use a knife to cut a...
20 KB (2,830 words) - 10:43, 23 June 2024

A scatter plot, also called a scatterplot, scatter graph, scatter chart, scattergram, or scatter diagram, is a type of plot or mathematical diagram using...
10 KB (1,063 words) - 14:10, 12 June 2024
Surface plot may refer to: Surface plot (mathematics), a graph of a function of two variables Surface plot (graphics), the visualization of a surface Surface...
215 bytes (59 words) - 05:47, 15 November 2023

Radar chart (redirect from Star plot)
display data in terms of polar coordinate. Plan position indicator Plot (graphics) Polar area diagram Parallel coordinates Radial tree This article incorporates...
20 KB (2,497 words) - 06:58, 17 June 2024

multivariate statistics, a scree plot is a line plot of the eigenvalues of factors or principal components in an analysis. The scree plot is used to determine the...
4 KB (442 words) - 16:42, 2 July 2023
Statistical graphics, also known as statistical graphical techniques, are graphics used in the field of statistics for data visualization. Whereas statistics...
7 KB (700 words) - 13:35, 30 April 2024

a volcano plot is a type of scatter-plot that is used to quickly identify changes in large data sets composed of replicate data. It plots significance...
6 KB (700 words) - 10:33, 28 November 2023

Graph of a function (redirect from Surface plot (mathematics))
the simplest case one variable is plotted as a function of another, typically using rectangular axes; see Plot (graphics) for details. A graph of a function...
7 KB (961 words) - 12:35, 15 March 2024
computational biology, an MA plot is an application of a Bland–Altman plot for visual representation of genomic data. The plot visualizes the differences...
6 KB (760 words) - 23:59, 2 December 2023

A Tauc plot is used to determine the optical bandgap, or Tauc bandgap, of either disordered or amorphous semiconductors. In his original work Jan Tauc...
4 KB (517 words) - 09:19, 17 March 2023

In biochemistry, a Ramachandran plot (also known as a Rama plot, a Ramachandran diagram or a [φ,ψ] plot), originally developed in 1963 by G. N. Ramachandran...
15 KB (1,715 words) - 22:11, 14 May 2024
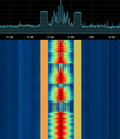
Waterfall plots are often used to show how two-dimensional phenomena change over time. A three-dimensional spectral waterfall plot is a plot in which multiple...
3 KB (173 words) - 15:21, 14 April 2024

A funnel plot is a graph designed to check for the existence of publication bias; funnel plots are commonly used in systematic reviews and meta-analyses...
7 KB (751 words) - 08:27, 28 March 2023

Vector graphics are a form of computer graphics in which visual images are created directly from geometric shapes defined on a Cartesian plane, such as...
27 KB (3,030 words) - 07:25, 29 April 2024

In orbital mechanics, a porkchop plot (also pork-chop plot) is a chart that shows level curves of equal characteristic energy (C3) against combinations...
4 KB (373 words) - 21:26, 18 April 2024


control theory, a Bode plot /ˈboʊdi/ is a graph of the frequency response of a system. It is usually a combination of a Bode magnitude plot, expressing the magnitude...
31 KB (4,705 words) - 17:03, 21 May 2024

Wikimedia Commons has media related to Forest plots. A forest plot, also known as a blobbogram, is a graphical display of estimated results from a number...
10 KB (1,237 words) - 02:29, 10 October 2023
additional investigation of the effect size is typically advisable, e.g., a Q–Q plot in this case. Monte Carlo simulation has found that Shapiro–Wilk has the...
7 KB (874 words) - 06:11, 12 April 2024

A cobweb plot, known also as Lémeray Diagram or Verhulst diagram is a visual tool used in the dynamical systems field of mathematics to investigate the...
3 KB (414 words) - 17:24, 6 March 2024
kinetics, an Arrhenius plot displays the logarithm of a reaction rate constant, ( ln ( k ) {\displaystyle \ln(k)} , ordinate axis) plotted against reciprocal...
6 KB (848 words) - 19:41, 8 April 2024
The Nichols plot is a plot used in signal processing and control design, named after American engineer Nathaniel B. Nichols. Given a transfer function...
2 KB (359 words) - 00:57, 22 March 2023
In biochemistry, the Lineweaver–Burk plot (or double reciprocal plot) is a graphical representation of the Michaelis–Menten equation of enzyme kinetics...
7 KB (1,029 words) - 05:43, 29 August 2023
A Levenspiel plot is a plot used in chemical reaction engineering to determine the required volume of a chemical reactor given experimental data on the...
2 KB (317 words) - 16:13, 5 December 2017
Ace Combat Zero: The Belkan War (section Plot)
mixed but generally positive reception on release, with praise for its plot, graphics, and refined game mechanics compared to its predecessors, but criticism...
16 KB (1,859 words) - 16:26, 31 March 2024