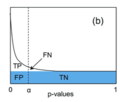
p-value, the q-value gives the expected pFDR obtained by rejecting the null hypothesis for any result with an equal or smaller q-value. In statistics,...
9 KB (1,304 words) - 17:22, 17 February 2025
ionizing radiation dosimetry Q factor (bicycles), the width between where a bicycle's pedals attach to the cranks q-value (statistics), the minimum false discovery...
982 bytes (175 words) - 13:57, 1 July 2021

Quantile (category Summary statistics)
points. q-quantiles are values that partition a finite set of values into q subsets of (nearly) equal sizes. There are q − 1 partitions of the q-quantiles...
31 KB (3,228 words) - 20:22, 24 May 2025
In statistics, Dixon's Q test, or simply the Q test, is used for identification and rejection of outliers. This assumes normal distribution and per Robert...
6 KB (567 words) - 03:27, 31 July 2024

In statistics, a Q–Q plot (quantile–quantile plot) is a probability plot, a graphical method for comparing two probability distributions by plotting their...
21 KB (2,518 words) - 00:48, 20 March 2025

theory, the expected value (also called expectation, expectancy, expectation operator, mathematical expectation, mean, expectation value, or first moment)...
52 KB (7,614 words) - 16:31, 25 May 2025

variable which takes the value 1 with probability p {\displaystyle p} and the value 0 with probability q = 1 − p {\displaystyle q=1-p} . Less formally, it...
13 KB (2,196 words) - 21:53, 27 April 2025
Kullback–Leibler divergence (section Statistics)
In mathematical statistics, the Kullback–Leibler (KL) divergence (also called relative entropy and I-divergence), denoted D KL ( P ∥ Q ) {\displaystyle...
77 KB (13,054 words) - 16:34, 16 May 2025

In probability and statistics, the quantile function is a function Q : [ 0 , 1 ] ↦ R {\displaystyle Q:[0,1]\mapsto \mathbb {R} } which maps some probability...
17 KB (2,235 words) - 12:04, 29 May 2025
Mean (redirect from Mean value)
extreme values of the set of numbers. There are several kinds of means (or "measures of central tendency") in mathematics, especially in statistics. Each...
17 KB (2,244 words) - 17:09, 25 April 2025

In statistics, the Q-function is the tail distribution function of the standard normal distribution. In other words, Q ( x ) {\displaystyle Q(x)} is the...
20 KB (2,964 words) - 18:40, 13 March 2025

synonymous with mathematical statistics. The term statistic, in singular form, is used to describe a function that returns its value of the same name. When...
78 KB (8,835 words) - 21:43, 31 May 2025

Order statistic (redirect from Order statistics)
In statistics, the kth order statistic of a statistical sample is equal to its kth-smallest value. Together with rank statistics, order statistics are...
28 KB (4,933 words) - 10:34, 6 February 2025

first quartile value (Q1) from the third quartile value (Q3): IQR = Q 3 − Q 1 = 75 ∘ F − 66 ∘ F = 9 ∘ F . {\displaystyle {\text{IQR}}=Q_{3}-Q_{1}=75^{\circ...
20 KB (3,012 words) - 00:34, 29 April 2025
The first quartile ( Q {\displaystyle Q} 1) is defined as the middle data point or value that is halfway between the smallest value (minimum) and the median...
35 KB (4,051 words) - 21:58, 23 January 2025
In statistics, the mode is the value that appears most often in a set of data values. If X is a discrete random variable, the mode is the value x at which...
16 KB (2,010 words) - 09:29, 21 May 2025
Quartile (redirect from Q2 (statistics))
typical values must be analyzed. The Interquartile Range (IQR), defined as the difference between the upper and lower quartiles ( Q 3 − Q 1 {\textstyle Q_{3}-Q_{1}}...
16 KB (2,225 words) - 03:52, 26 May 2025

Median (redirect from Median (statistics))
reason, the median is of central importance in robust statistics. Median is a 2-quantile; it is the value that partitions a set into two equal parts. The median...
63 KB (8,022 words) - 02:51, 20 May 2025
Errors and residuals (redirect from Error (statistics))
In statistics and optimization, errors and residuals are two closely related and easily confused measures of the deviation of an observed value of an element...
16 KB (2,164 words) - 16:12, 23 May 2025
Outlier (redirect from Outliers in statistics)
outside the range: [ Q 1 − k ( Q 3 − Q 1 ) , Q 3 + k ( Q 3 − Q 1 ) ] {\displaystyle {\big [}Q_{1}-k(Q_{3}-Q_{1}),Q_{3}+k(Q_{3}-Q_{1}){\big ]}} for some...
27 KB (3,491 words) - 03:04, 9 February 2025
question, and each with its own Boolean-valued outcome: success (with probability p) or failure (with probability q = 1 − p). A single success/failure experiment...
53 KB (7,554 words) - 03:55, 26 May 2025

In probability theory and statistics, skewness is a measure of the asymmetry of the probability distribution of a real-valued random variable about its...
28 KB (3,968 words) - 13:28, 18 April 2025
and statistics, the generalized extreme value (GEV) distribution is a family of continuous probability distributions developed within extreme value theory...
26 KB (3,823 words) - 21:58, 3 April 2025

statistics, a credible interval is an interval used to characterize a probability distribution. It is defined such that an unobserved parameter value...
8 KB (1,037 words) - 22:16, 19 May 2025
the nominal value Q {\displaystyle Q} of a quantity, such as wages or total production, to obtain its real value. The real value is the value expressed...
11 KB (1,714 words) - 20:42, 5 December 2024
with: "p-values and significance tests, when properly applied and interpreted, increase the rigor of the conclusions drawn from data". In statistics, every...
55 KB (6,800 words) - 10:47, 2 June 2025
Goodman and Kruskal's gamma (redirect from Gamma test (statistics))
of events, where each value is a count of an event's frequency: Yule's Q is given by: Q = a d − b c a d + b c . {\displaystyle Q={\frac {ad-bc}{ad+bc}}\...
6 KB (773 words) - 05:33, 23 November 2022
are positive with probability 1 under Q {\displaystyle Q} . From this angle, the main innovation of the e-value compared to traditional testing is to...
40 KB (6,530 words) - 05:13, 2 June 2025
Standard deviation (category Summary statistics)
In statistics, the standard deviation is a measure of the amount of variation of the values of a variable about its mean. A low standard deviation indicates...
59 KB (8,233 words) - 19:16, 23 April 2025
with the IQR the normalized value gets less sensitive for extreme values in the target variable. R M S D I Q R = R M S D I Q R {\displaystyle \mathrm {RMSDIQR}...
11 KB (1,620 words) - 18:39, 16 February 2025