Statistical graphics, also known as statistical graphical techniques, are graphics used in the field of statistics for data visualization. Whereas statistics...
7 KB (708 words) - 05:29, 5 May 2025

Infographic (redirect from Informational graphics)
Similar pursuits are information visualization, data visualization, statistical graphics, information design, or information architecture. Infographics have...
40 KB (4,817 words) - 17:12, 27 April 2025
their days "statistical graphics appear to be reemerging as an important analytic tool, with recent innovations exploiting computer graphics and related...
7 KB (789 words) - 17:25, 19 February 2025
their main characteristics, often using statistical graphics and other data visualization methods. A statistical model can be used or not, but primarily...
19 KB (2,202 words) - 16:09, 15 January 2025

visualization is a related subcategory of visualization dealing with statistical graphics and geospatial data (as in thematic cartography) that is abstracted...
26 KB (3,072 words) - 22:36, 21 March 2025
Graphics (from Ancient Greek γραφικός (graphikós) 'pertaining to drawing, painting, writing, etc.') are visual images or designs on some surface, such...
21 KB (2,724 words) - 12:45, 1 May 2025
Data and information visualization (redirect from Data graphics)
analysis, such as statistical hypothesis testing. To communicate information clearly and efficiently, data visualization uses statistical graphics, plots, information...
89 KB (8,241 words) - 18:48, 16 May 2025

Computer graphics deals with generating images and art with the aid of computers. Computer graphics is a core technology in digital photography, film,...
70 KB (8,842 words) - 03:53, 13 May 2025
The following is a list of statistical software. ADaMSoft – a generalized statistical software with data mining algorithms and methods for data management...
14 KB (1,450 words) - 23:35, 11 May 2025

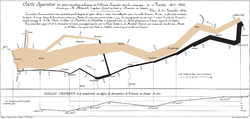
Charles Joseph Minard (section Information graphics)
diagram is from 1825,: 16 but he did not start regularly producing statistical graphics until the 1840s. During this period he became interested in studying...
17 KB (1,680 words) - 04:05, 5 May 2025
the statistical programming language R. Created by Hadley Wickham in 2005, ggplot2 is an implementation of Leland Wilkinson's Grammar of Graphics—a general...
12 KB (1,204 words) - 16:09, 13 May 2025
William Playfair (category Statistical charts and diagrams)
of the Father of Statistical Graphics. University of Toronto Press. ISBN 978-1-4875-4503-1. JSTOR 10.3138/jj.6167271. Royal Statistical Society Lecture...
29 KB (3,370 words) - 09:25, 9 March 2025

our brains have more difficulty decoding, is fundamental to good statistical graphics design, where clarity, transparency, accuracy and precision in data...
7 KB (765 words) - 22:55, 31 March 2025
presentation that accompanies the slide show, but in many cases, such as statistical graphics, it can be difficult to convey essential information other than by...
14 KB (1,638 words) - 06:37, 6 May 2025
Unit of observation (category Statistical data types)
such data points. In addition, in statistical graphics, a "data point" may be an individual item with a statistical display; such points may relate to...
4 KB (465 words) - 19:10, 1 November 2023

identification, factor effect determination, outlier detection. Statistical graphics give insight into aspects of the underlying structure of the data...
20 KB (2,604 words) - 07:11, 18 March 2025
for "describe," "write" or "draw") List of information graphics software Statistical graphics This disambiguation page lists articles associated with...
1 KB (186 words) - 15:43, 14 February 2025

Pie chart (category Statistical charts and diagrams)
ISBN 0-534-03730-5. Friendly, Michael. "The Golden Age of Statistical Graphics," Statistical Science, Volume 23, Number 4 (2008), 502–535 Good, Phillip...
22 KB (2,340 words) - 01:45, 6 May 2025

Edward Tufte (redirect from Graphics Press)
study economics. He developed a set of readings and lectures on statistical graphics, which he further developed in joint seminars he taught with renowned...
34 KB (3,065 words) - 04:17, 5 May 2025

Radar chart (category Statistical charts and diagrams)
cartography, statistical graphics, and data visualization" Archived 2018-09-26 at the Wayback Machine. Michael Friendly (1991). "Statistical Graphics for Multivariate...
20 KB (2,497 words) - 06:58, 5 March 2025

Florence Nightingale (category Fellows of the Royal Statistical Society)
Nightingale became a pioneer in the visual presentation of information and statistical graphics. She used methods such as the pie chart, which had first been developed...
128 KB (13,369 words) - 20:34, 13 May 2025

This is a list of software to create any kind of information graphics: either includes the ability to create one or more infographics from a provided data...
23 KB (225 words) - 13:32, 15 April 2025

Representation". Proceedings of the Section on Statistical Graphics. Alexandria, VA: American Statistical Association. pp. 55–60. Archived from the original...
13 KB (1,470 words) - 14:13, 2 March 2025
TODAY movie review content. Snapshots API retrieves easy-to-read statistical graphics that present information on various issues and trends in a visually...
10 KB (37 words) - 03:41, 12 January 2025
Journal of Computational and Graphical Statistics (redirect from Journal of Computational and Statistical Graphics)
scientific journal published by Taylor & Francis on behalf of the American Statistical Association. Established in 1992, the journal covers the use of computational...
2 KB (109 words) - 18:13, 6 November 2024

t-distributed stochastic neighbor embedding (t-SNE) is a statistical method for visualizing high-dimensional data by giving each datapoint a location...
15 KB (2,065 words) - 03:13, 22 April 2025

Information Systems. 22 (2): 23–52. doi:10.2308/jis.2008.22.2.23. Gallery of Data Visualization The Best and Worst of Statistical Graphics, York University...
39 KB (4,196 words) - 05:25, 30 April 2025
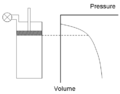
The indicator diagram constitutes one of the earliest examples of statistical graphics. It may be significant that Watt and Southern developed the indicator...
7 KB (957 words) - 19:09, 7 February 2025
Presentation Graphics". In Hornik, Kurt; Leisch, Friedrich; Zeileis, Achim (eds.). Proceedings of the 3rd International Workshop on Distributed Statistical Computing...
11 KB (1,325 words) - 22:40, 21 April 2025

Line chart (category Statistical charts and diagrams)
Friendly (2008). "Milestones in the history of thematic cartography, statistical graphics, and data visualization". pp 13–14. Retrieved 7 July 2008. Fry, Hannah...
6 KB (779 words) - 23:25, 6 March 2025