
In descriptive statistics, a box plot or boxplot is a method for demonstrating graphically the locality, spread and skewness groups of numerical data through...
20 KB (2,992 words) - 09:09, 23 July 2025

A violin plot is a statistical graphic for comparing probability distributions. It is similar to a box plot, with the addition of a rotated kernel density...
4 KB (483 words) - 20:00, 9 July 2025

Wikimedia Commons has media related to Forest plots. A forest plot, also known as a blobbogram, is a graphical display of estimated results from a number...
10 KB (1,276 words) - 03:26, 3 March 2025

language. The plotnine library of the Python programming language. Violin plot Box plot Sidiropoulos, Nikos; Sohi, Sina Hadi; Pedersen, Thomas Lin; Porse, Bo...
3 KB (315 words) - 00:17, 20 June 2025

structure. Drain Plot. Biplot Bland–Altman plot Box plot Carpet plot Contour plot Logarithmic plot Parallel Category Plot Funnel plot : This is a useful...
20 KB (2,606 words) - 05:30, 21 July 2025

statistics, a Q–Q plot (quantile–quantile plot) is a probability plot, a graphical method for comparing two probability distributions by plotting their quantiles...
21 KB (2,518 words) - 10:49, 4 July 2025

A scatter plot, also called a scatterplot, scatter graph, scatter chart, scattergram, or scatter diagram, is a type of plot or mathematical diagram using...
12 KB (1,332 words) - 18:31, 7 August 2025
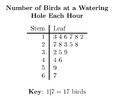
Stem-and-leaf display (redirect from Stem-and-leaf plot)
very cluttered, since each data point must be represented numerically. A box plot or histogram may become more appropriate as the data size increases. a│abdeghilmnrstwxy...
8 KB (1,090 words) - 08:55, 1 July 2025
Biostatistics (section Box plot)
dataset. The mode is the value of a set of data that appears most often. Box plot is a method for graphically depicting groups of numerical data. The maximum...
54 KB (6,600 words) - 15:08, 30 July 2025

as a robust measure of scale It can be clearly visualized by the box on a box plot. Unlike total range, the interquartile range has a breakdown point...
10 KB (1,131 words) - 00:32, 18 July 2025
can be applied to tabular data (spreadsheet, data frame) or visual data (box plot and bar chart). Each variable that shares a mean that is not statistically...
11 KB (1,269 words) - 17:03, 23 June 2025
Plotly is a technical computing company headquartered in Montreal, Quebec, that develops online data analytics and visualization tools. Plotly provides...
22 KB (1,289 words) - 13:36, 24 June 2025
the development of the fast Fourier Transform (FFT) algorithm and the box plot. The Tukey range test, the Tukey lambda distribution, the Tukey test of...
28 KB (2,377 words) - 11:18, 24 July 2025

Variable-width bar chart Box plot Dispersion fan diagram Graph of a function Logarithmic graph paper Heatmap Line chart Pie chart Plotting Radar chart Scatterplot...
4 KB (335 words) - 04:31, 6 November 2024
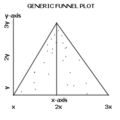
A funnel plot is a graph designed to check for the existence of publication bias; funnel plots are commonly used in systematic reviews and meta-analyses...
7 KB (751 words) - 19:47, 24 May 2025
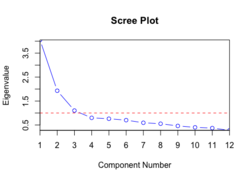
multivariate statistics, a scree plot is a line plot of the eigenvalues of factors or principal components in an analysis. The scree plot is used to determine the...
4 KB (430 words) - 11:15, 24 June 2025
sets, the box plot is usually easier to read than the seasonal subseries plot. The seasonal plot, seasonal subseries plot, and the box plot all assume...
22 KB (2,512 words) - 16:48, 18 July 2025
graphic analyst and author, who pioneered development of the bar chart and box plot. Mary Eleanor Hunt was born in Jonesboro, Indiana, the daughter of Amos...
10 KB (944 words) - 06:19, 2 June 2025
summary, sometimes extended to a seven-number summary, and the associated box plot. Entries in an analysis of variance table can also be regarded as summary...
6 KB (540 words) - 01:53, 11 January 2024

a volcano plot is a type of scatter-plot that is used to quickly identify changes in large data sets composed of replicate data. It plots significance...
6 KB (756 words) - 18:50, 18 June 2025

heading of exploratory data analysis: an example of such a technique is the box plot. In the business world, descriptive statistics provides a useful summary...
8 KB (960 words) - 10:35, 24 June 2025
As with the five-number summary, it can be represented by a modified box plot, adding hatch-marks on the "whiskers" for two of the additional numbers...
7 KB (561 words) - 02:21, 9 February 2025
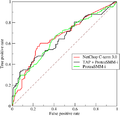
Receiver operating characteristic (redirect from ROC plot)
A receiver operating characteristic curve, or ROC curve, is a graphical plot that illustrates the performance of a binary classifier model (can be used...
62 KB (7,929 words) - 05:43, 2 July 2025

recommended alternatives to pie charts in most cases include bar charts, box plots, and dot plots. The earliest known pie chart is generally credited to William...
22 KB (2,338 words) - 19:11, 9 August 2025

visualization approaches for distributions, such as box plots, or violin plots. Advanced features of UpSet plots include querying, grouping and aggregating data...
7 KB (671 words) - 13:10, 1 August 2025
The Korea Times stated the plot was "convoluted". "KOFIC, KOBIS (Korean Box Office Information System) The Box office: The Plot (2024)". KOFIC. Retrieved...
9 KB (892 words) - 22:34, 23 July 2025
approaches are visualization (histograms, scatter plots, surface plots, tree maps, parallel coordinate plots, etc.), statistics (hypothesis test, regression...
82 KB (7,728 words) - 13:41, 7 August 2025

A ridgeline plot (also known as a joyplot) is a series of line plots that are combined by vertical stacking to allow the easy visualization of changes...
2 KB (161 words) - 15:06, 1 June 2025

that time period.[citation needed] They are visually similar to box plots, though box plots show different information. Candlestick charts are thought to...
8 KB (1,013 words) - 22:38, 11 July 2025