
Control charts are graphical plots used in production control to determine whether quality and manufacturing processes are being controlled under stable...
32 KB (3,817 words) - 15:32, 19 May 2025
lawsuit in March 2014 by Media Control AG, Media Control GfK International had to change its name. Dissemination of the charts is conducted by various media...
9 KB (904 words) - 14:04, 15 April 2025

some of them: Control chart Greninger chart Heatmap Natal chart Nomogram Pareto chart Run chart Strip chart Structure chart Vowel chart One more example:...
13 KB (1,513 words) - 22:21, 24 May 2025
management. A control chart is a more specific kind of run chart. The control chart is one of the seven basic tools of quality control, which also include...
10 KB (1,261 words) - 01:28, 22 July 2025

In statistical quality control, the individual/moving-range chart is a type of control chart used to monitor variables data from a business or industrial...
10 KB (1,166 words) - 15:43, 12 June 2025
2025. "Teddy Swims – Lose Control". Swiss Singles Chart. Retrieved February 4, 2024. Top Radio Hits Ukraine Weekly Chart. TopHit. June 28, 2024. Retrieved...
56 KB (3,801 words) - 03:28, 2 August 2025
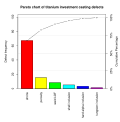
purpose of the Pareto chart is to highlight the most important among a (typically large) set of factors. In quality control, Pareto charts are useful to find...
4 KB (462 words) - 11:11, 8 July 2025
Distribution-free (nonparametric) control charts are one of the most important tools of statistical process monitoring and control. Implementation techniques...
4 KB (503 words) - 23:26, 30 December 2024
version of Raf's "Self Control", which was a commercial success, peaking at number four on the US Billboard Hot 100 and topping the charts in Canada and several...
19 KB (1,211 words) - 04:32, 5 June 2025

specifications) output can be measured. Key tools used in SPC include run charts, control charts, a focus on continuous improvement, and the design of experiments...
21 KB (2,621 words) - 02:45, 24 June 2025

In statistical quality control, the p-chart is a type of control chart used to monitor the proportion of nonconforming units in a sample, where the sample...
8 KB (760 words) - 08:10, 9 February 2024

Flowchart (redirect from Flow-chart)
as "cross-functional" when the chart is divided into different vertical or horizontal parts, to describe the control of different organizational units...
23 KB (1,764 words) - 03:19, 22 July 2025

pie chart (or a circle chart) is a circular statistical graphic which is divided into slices to illustrate numerical proportion. In a pie chart, the...
22 KB (2,340 words) - 19:01, 12 July 2025

A bar chart or bar graph is a chart or graph that presents categorical data with rectangular bars with heights or lengths proportional to the values that...
7 KB (811 words) - 00:33, 15 July 2025
CUSUM (redirect from Cumulative sum control chart)
In statistical quality control, the CUSUM (or cumulative sum control chart) is a sequential analysis technique developed by E. S. Page of the University...
7 KB (726 words) - 20:23, 8 December 2024
in the Swiss charts), with Branigan's rendition becoming the most successful single of the year in Germany and Switzerland. "Self Control" has become one...
47 KB (3,992 words) - 04:26, 11 July 2025

In statistical quality control, an EWMA chart (or exponentially weighted moving average chart) is a type of control chart used to monitor either variables...
6 KB (684 words) - 23:34, 30 December 2024
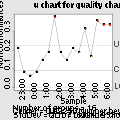
In statistical quality control, a u-chart is a type of control chart used to monitor "count"-type data where the sample size is greater than one, typically...
3 KB (282 words) - 00:22, 31 December 2024
In statistical quality control, the regression control chart allows for monitoring a change in a process where two or more variables are correlated. The...
1 KB (133 words) - 00:16, 15 April 2023
In statistical process control (SPC), the x ¯ {\displaystyle {\bar {x}}} and R chart, also known as an averages and range chart is a type of scheme, popularly...
8 KB (775 words) - 04:44, 20 July 2025

quality control, the np-chart is a type of control chart used to monitor the number of nonconforming units in a sample. It is an adaptation of the p-chart and...
2 KB (181 words) - 19:41, 30 September 2019
A target chart, also known as a difference chart, deviation chart, or nominal chart is a control chart that plots the deviation from the nominal value...
936 bytes (79 words) - 21:30, 14 March 2025

Nelson rules (category Quality control tools)
Technology in an article by Lloyd S. Nelson. The rules are applied to a control chart on which the magnitude of some variable is plotted against time. The...
5 KB (354 words) - 15:08, 25 June 2025
Seven basic tools of quality (redirect from Seven Basic Tools of Quality Control)
Cause-and-effect diagram Check sheet Control chart Histogram Pareto chart Scatter diagram Flow chart Run chart The seven basic tools of quality are a...
7 KB (752 words) - 17:45, 6 April 2025
Western Electric rules (category Quality control tools)
control for detecting out-of-control or non-random conditions on control charts. Locations of the observations relative to the control chart control limits...
8 KB (659 words) - 11:02, 3 November 2023

A record chart, in the music industry, also called a music chart, is a ranking of recorded music according to certain criteria during a given period....
9 KB (1,225 words) - 16:17, 20 July 2025

chart is also known as web chart, spider chart, spider graph, spider web chart, star chart, star plot, cobweb chart, irregular polygon, polar chart,...
20 KB (2,505 words) - 11:37, 21 July 2025

A scientific control is an experiment or observation designed to minimize the effects of variables other than the independent variable (i.e. confounding...
25 KB (3,157 words) - 15:20, 24 June 2025
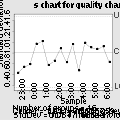
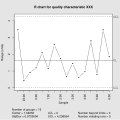
In statistical quality control, the x ¯ {\displaystyle {\bar {x}}} and s chart is a type of control chart used to monitor variables data when samples are...
10 KB (994 words) - 04:44, 20 July 2025
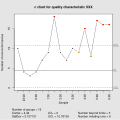
In statistical quality control, the c-chart is a type of control chart used to monitor "count"-type data, typically total number of nonconformities per...
3 KB (364 words) - 07:46, 30 March 2024