
A radar chart is a graphical method of displaying multivariate data in the form of a two-dimensional chart of three or more quantitative variables represented...
20 KB (2,497 words) - 06:58, 5 March 2025
"Radar Love" is a song by the Dutch rock band Golden Earring. The single version of "Radar Love" reached No. 9 on the Record World chart, No. 10 on Cash...
14 KB (1,283 words) - 03:45, 21 June 2025

Coxcomb chart, is an enhanced form of pie chart developed by Florence Nightingale. A radar chart or "spider chart" or "doi" is a two-dimensional chart of three...
13 KB (1,513 words) - 22:21, 24 May 2025
and also criticized her vocals for being processed. In July 2008, "Radar" charted in the top 40 of Ireland and New Zealand, and inside the top ten in...
42 KB (3,955 words) - 18:42, 18 April 2025

pie chart (or a circle chart) is a circular statistical graphic which is divided into slices to illustrate numerical proportion. In a pie chart, the...
22 KB (2,340 words) - 01:45, 6 May 2025
On the Radar Freestyle" (in Dutch). Single Top 100. Retrieved August 5, 2023. "Drake, Central Cee – On the Radar Freestyle". Swiss Singles Chart. Retrieved...
6 KB (505 words) - 06:14, 20 November 2024

A bar chart or bar graph is a chart or graph that presents categorical data with rectangular bars with heights or lengths proportional to the values that...
7 KB (811 words) - 20:27, 20 June 2025

Scatter plot (redirect from Scatter chart)
A scatter plot, also called a scatterplot, scatter graph, scatter chart, scattergram, or scatter diagram, is a type of plot or mathematical diagram using...
12 KB (1,332 words) - 13:51, 9 June 2025

Box plot (redirect from Box and whisker chart)
introduced by Mary Eleanor Spear in her book "Charting Statistics" in 1952 and again in her book "Practical Charting Techniques" in 1969. The box-and-whisker...
20 KB (3,012 words) - 00:34, 29 April 2025
A star chart is a map of the night sky. Star chart or starchart may also refer to: A Star plot, also known as a radar chart or cobweb chart, a graphical...
1 KB (177 words) - 22:43, 24 May 2023

plot Graphics Bar chart Biplot Box plot Control chart Correlogram Fan chart Forest plot Histogram Pie chart Q–Q plot Radar chart Run chart Scatter plot Stem-and-leaf...
22 KB (2,432 words) - 16:59, 17 March 2025

Control charts are graphical plots used in production control to determine whether quality and manufacturing processes are being controlled under stable...
32 KB (3,817 words) - 15:32, 19 May 2025
plot Graphics Bar chart Biplot Box plot Control chart Correlogram Fan chart Forest plot Histogram Pie chart Q–Q plot Radar chart Run chart Scatter plot Stem-and-leaf...
31 KB (4,000 words) - 19:33, 20 June 2025
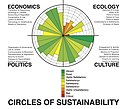
urban settlements. The style of the charts themselves could be described as a mixture of radar chart and bar chart. Circles of Sustainability, and its...
22 KB (2,636 words) - 14:28, 31 May 2025

plot Graphics Bar chart Biplot Box plot Control chart Correlogram Fan chart Forest plot Histogram Pie chart Q–Q plot Radar chart Run chart Scatter plot Stem-and-leaf...
24 KB (2,822 words) - 09:14, 1 June 2025

Violin plot (category Statistical charts and diagrams)
plot Graphics Bar chart Biplot Box plot Control chart Correlogram Fan chart Forest plot Histogram Pie chart Q–Q plot Radar chart Run chart Scatter plot Stem-and-leaf...
4 KB (483 words) - 09:12, 25 May 2025
yet abstract, representations of information, and maps, line graphs, bar charts, engineering blueprints, and architects' sketches are all examples of diagrams...
16 KB (1,045 words) - 06:35, 5 March 2025
officially launched on December 6, 2007. Currently, line, bar, pie, and radar charts, as well as Venn diagrams, scatter plots, sparklines, maps, google-o-meters...
5 KB (306 words) - 17:32, 3 July 2024
plot Graphics Bar chart Biplot Box plot Control chart Correlogram Fan chart Forest plot Histogram Pie chart Q–Q plot Radar chart Run chart Scatter plot Stem-and-leaf...
17 KB (2,244 words) - 17:09, 25 April 2025

plot Graphics Bar chart Biplot Box plot Control chart Correlogram Fan chart Forest plot Histogram Pie chart Q–Q plot Radar chart Run chart Scatter plot Stem-and-leaf...
17 KB (2,189 words) - 12:02, 28 May 2025
plot Graphics Bar chart Biplot Box plot Control chart Correlogram Fan chart Forest plot Histogram Pie chart Q–Q plot Radar chart Run chart Scatter plot Stem-and-leaf...
36 KB (4,606 words) - 12:37, 20 June 2025

Student's t-distribution (redirect from T-chart)
plot Graphics Bar chart Biplot Box plot Control chart Correlogram Fan chart Forest plot Histogram Pie chart Q–Q plot Radar chart Run chart Scatter plot Stem-and-leaf...
55 KB (6,423 words) - 06:46, 1 June 2025
Australia's Music Charts 1988–2010 (PDF ed.). Mt Martha, Victoria, Australia: Moonlight Publishing. p. 297. Liner notes from The Watchmen: Silent Radar. The Watchmen...
9 KB (1,035 words) - 15:41, 17 March 2025

radar range of land or special radar aids to navigation, the navigator can take distances and angular bearings to charted objects and use these to establish...
5 KB (504 words) - 15:24, 5 June 2025
plot Graphics Bar chart Biplot Box plot Control chart Correlogram Fan chart Forest plot Histogram Pie chart Q–Q plot Radar chart Run chart Scatter plot Stem-and-leaf...
16 KB (1,936 words) - 16:39, 24 May 2025

A run chart, also known as a run-sequence plot is a graph that displays observed data in a time sequence. Often, the data displayed represent some aspect...
3 KB (365 words) - 12:05, 14 September 2024
Psychometrics (redirect from Psychometric chart)
plot Graphics Bar chart Biplot Box plot Control chart Correlogram Fan chart Forest plot Histogram Pie chart Q–Q plot Radar chart Run chart Scatter plot Stem-and-leaf...
42 KB (4,805 words) - 21:48, 21 May 2025
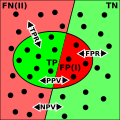
they are known as precision and recall. Cullerne Bown has suggested a flow chart for determining which pair of indicators should be used when. Otherwise...
12 KB (1,428 words) - 02:52, 25 May 2025
Ranking (redirect from Standings chart)
tables group teams of a particular league, conference, or division in a chart based on how well each is doing in a particular season of a sports league...
17 KB (2,416 words) - 05:56, 14 May 2025

Over-the-horizon radar (OTH), sometimes called beyond the horizon radar (BTH), is a type of radar system with the ability to detect targets at very long...
43 KB (5,307 words) - 15:27, 3 June 2025