
Wikimedia Commons has media related to Forest plots. A forest plot, also known as a blobbogram, is a graphical display of estimated results from a number...
10 KB (1,276 words) - 03:26, 3 March 2025

A ridgeline plot (also known as a joyplot) is a series of line plots that are combined by vertical stacking to allow the easy visualization of changes...
2 KB (161 words) - 15:06, 1 June 2025

epidemiology) and forest plots are often used in presenting the results of such studies also. Funnel plot Dot plot (statistics) Forest plot Galbraith plot : In statistics...
20 KB (2,604 words) - 07:11, 18 March 2025

In descriptive statistics, a box plot or boxplot is a method for demonstrating graphically the locality, spread and skewness groups of numerical data through...
20 KB (3,012 words) - 00:34, 29 April 2025

statistics, a Q–Q plot (quantile–quantile plot) is a probability plot, a graphical method for comparing two probability distributions by plotting their quantiles...
21 KB (2,518 words) - 00:48, 20 March 2025
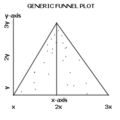
ability to visually discern publication bias from funnel plots. Galbraith plot Forest plot Systematic review R. J. Light; D. B. Pillemer (1984). Summing...
7 KB (751 words) - 19:47, 24 May 2025

A violin plot is a statistical graphic for comparing probability distributions. It is similar to a box plot, with the addition of a rotated kernel density...
4 KB (483 words) - 09:12, 25 May 2025

A scatter plot, also called a scatterplot, scatter graph, scatter chart, scattergram, or scatter diagram, is a type of plot or mathematical diagram using...
12 KB (1,328 words) - 00:24, 26 May 2025

heterogeneity in a meta-analysis, as an alternative or supplement to a forest plot. A Galbraith plot is produced by first calculating the standardized estimates...
4 KB (425 words) - 11:17, 26 October 2024
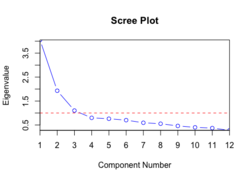
multivariate statistics, a scree plot is a line plot of the eigenvalues of factors or principal components in an analysis. The scree plot is used to determine the...
4 KB (442 words) - 13:21, 4 February 2025

a volcano plot is a type of scatter-plot that is used to quickly identify changes in large data sets composed of replicate data. It plots significance...
6 KB (756 words) - 20:28, 11 March 2025

The 20 July plot, sometimes referred to as Operation Valkyrie, was a failed attempt to assassinate Adolf Hitler, the chancellor and leader of Nazi Germany...
89 KB (10,304 words) - 10:33, 1 June 2025

Restricted randomization (redirect from Strip-plot design)
variation or restricted randomization discussed on this page are split-plot and strip-plot designs. The objective of an experiment with this type of sampling...
23 KB (3,310 words) - 04:58, 6 September 2022

"meta-analytic thinking". The results of a meta-analysis are often shown in a forest plot. Results from studies are combined using different approaches. One approach...
102 KB (11,905 words) - 09:20, 29 May 2025

to the kernel density. Sina plots are similar to violin plots, but while violin plots depict kernel density, sina plots depict the points themselves...
3 KB (315 words) - 13:42, 9 May 2025
Stem-and-leaf display (redirect from Stem-and-leaf plot)
A stem-and-leaf display or stem-and-leaf plot is a device for presenting quantitative data in a graphical format, similar to a histogram, to assist in...
7 KB (1,090 words) - 08:08, 5 March 2025
The "doctors' plot" (Russian: дело врачей, romanized: delo vrachey, lit. 'doctors' case') was a Soviet state-sponsored anti-intellectual and anti-cosmopolitan...
34 KB (3,908 words) - 02:47, 26 May 2025

visualised. One method uses a forest plot (also called a blobbogram). In an intervention effect review, the diamond in the 'forest plot' represents the combined...
84 KB (9,028 words) - 16:05, 23 May 2025

Radar chart (redirect from Star plot)
star chart, star plot, cobweb chart, irregular polygon, polar chart, or Kiviat diagram. It is equivalent to a parallel coordinates plot, with the axes arranged...
20 KB (2,497 words) - 06:58, 5 March 2025
additional investigation of the effect size is typically advisable, e.g., a Q–Q plot in this case. Monte Carlo simulation has found that Shapiro–Wilk has the...
7 KB (790 words) - 21:08, 20 April 2025

headquarters, a series of concrete bunkers and shelters located deep in the forest of East Prussia, not far from the location of the World War I Battle of...
20 KB (336 words) - 17:57, 4 June 2025
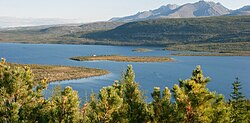
Taiga (redirect from Boreal forest)
forest or snow forest, is a biome characterized by coniferous forests consisting mostly of pines, spruces, and larches. The taiga, or boreal forest,...
81 KB (9,449 words) - 21:15, 22 May 2025
Line plot survey is a systematic sampling technique used on land surfaces for laying out sample plots within a rectangular grid to conduct forest inventory...
2 KB (350 words) - 22:14, 11 December 2017
tool for assessing normality is the normal probability plot, a quantile-quantile plot (QQ plot) of the standardized data against the standard normal distribution...
12 KB (1,624 words) - 06:30, 27 August 2024

Run chart (redirect from Run sequence plot)
A run chart, also known as a run-sequence plot is a graph that displays observed data in a time sequence. Often, the data displayed represent some aspect...
3 KB (365 words) - 12:05, 14 September 2024
actual mix of the forest. As they are close to each other there is less walking needed and so it is more efficient. In a fixed radius plot, the forester finds...
19 KB (2,479 words) - 19:43, 26 February 2025

x-axis are all 1, then a histogram is identical to a relative frequency plot. Histograms are sometimes confused with bar charts. In a histogram, each...
27 KB (3,334 words) - 14:47, 21 May 2025

robust measure of scale It can be clearly visualized by the box on a box plot. Unlike total range, the interquartile range has a breakdown point of 25%...
10 KB (1,144 words) - 14:51, 27 February 2025
Back to the Forest (のどか森の動物大作戦, Nodoka Mori no Doubutsu Daisakusen, lit. The Great Plot of the Animals of Placid Forest) is a Japanese anime television...
8 KB (1,089 words) - 23:20, 16 November 2024