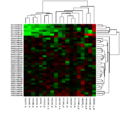
A heat map (or heatmap) is a 2-dimensional data visualization technique that represents the magnitude of individual values within a dataset as a color...
36 KB (3,898 words) - 20:18, 7 May 2025

Choropleth maps provide an easy way to visualize how a variable varies across a geographic area or show the level of variability within a region. A heat map or...
39 KB (4,886 words) - 23:34, 27 April 2025
People counter (section Bubble map/heat map)
map or heat map allows users to analyze the number of engagement in percentage across the entire compound at a period of time. Bubble maps and heat maps...
19 KB (2,116 words) - 14:07, 7 May 2025
box-and-whisker plots), geospatial maps (such as proportional symbol maps, choropleth maps, isopleth maps and heat maps), figures, correlation matrices,...
89 KB (8,241 words) - 08:17, 20 May 2025

aid performance analysis, including latency heat maps, utilization heat maps, subsecond offset heat maps, and flame graphs. His tools are included in...
9 KB (670 words) - 11:25, 27 September 2024

measure of the amplitude or power of the signal. It could be considered a heat map of I/Q data. In a digital modulation system, information is transmitted...
7 KB (983 words) - 05:56, 6 March 2025
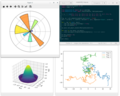
factors: Comparing a relationship between different variables: line plot, heat map, contour plot, scatter plot Looking for distribution of your dataset: box...
13 KB (1,250 words) - 14:06, 29 April 2025
Strava's segments feature. In June 2023, a report claimed that Strava heat map data could be used to reveal the home addresses of highly active users...
21 KB (1,898 words) - 04:08, 20 March 2025
The company has mapped approximately 650,000 houses in India. Housing.com's Data Science Lab (DSL) has generated a number of "Heat Map" algorithms and...
12 KB (921 words) - 06:27, 23 December 2024
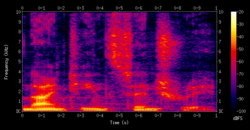
as a scaleogram or scalogram). A spectrogram is usually depicted as a heat map, i.e., as an image with the intensity shown by varying the colour or brightness...
20 KB (2,187 words) - 07:43, 9 December 2024

A heat wave or heatwave, sometimes described as extreme heat, is a period of abnormally hot weather : 2911 generally considered to be at least five consecutive...
53 KB (9,253 words) - 12:08, 15 May 2025
mode of operation, see below). These recorded values are displayed as a heat map to produce the final STM images, usually using a black and white or an...
29 KB (3,378 words) - 04:36, 25 March 2025
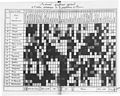
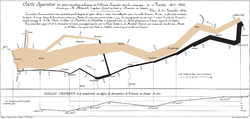
(1824 – 1907) was a French statistician and was credited for inventing the heat map in information visualization. Loua was born in Saarn in modern day Germany...
4 KB (360 words) - 20:38, 21 January 2025
harmonic maps. Their work was the inspiration for Richard Hamilton's initial work on the Ricci flow. Harmonic maps and the associated harmonic map heat flow...
39 KB (5,241 words) - 19:09, 16 March 2025
world maps date to classical antiquity, the oldest examples of the 6th to 5th centuries BCE still based on the flat Earth paradigm. World maps assuming...
73 KB (8,596 words) - 22:27, 18 May 2025
Bing Maps (previously Live Search Maps, Windows Live Maps, Windows Live Local, and MSN Virtual Earth) is a web mapping service provided as a part of Microsoft's...
46 KB (3,322 words) - 01:14, 5 October 2024
This way you can identify and pick the most prominent topics. Matrix/heat map search – The classification of information into topics facilitates visualization...
7 KB (913 words) - 11:13, 21 May 2025

An alternative approach for larger datasets is to show a co-occurrence heat map, though these cannot show higher-order intersections Euler diagram Venn...
7 KB (675 words) - 16:01, 8 April 2025
List of online map services GraphHopper Navteq Petal Maps Online virtual globes Tencent Maps Traffic Message Channel (TMC) "Bing Maps Geographic Coverage"...
26 KB (375 words) - 16:20, 23 April 2025

Wilkinson, Leland; Friendly, Michael (May 2009). "The History of the Cluster Heat Map". The American Statistician. 63 (2): 179–184. CiteSeerX 10.1.1.165.7924...
6 KB (499 words) - 07:10, 2 May 2025
place was popularised by author William Least Heat-Moon with his book PrairyErth: A Deep Map. A deep map work can take the form of engaged documentary...
4 KB (511 words) - 02:18, 4 October 2024
Thematic maps, charts, data science, spreadsheets, and other tools which use graphical means to visualize quantitative data. They are common in heat maps, choropleths...
27 KB (3,155 words) - 12:01, 21 April 2025
enabled. It has seen over 780,000 players explore its procedurally generated map, increasing its file size to almost 60 terabytes. 2b2t has been described...
35 KB (3,479 words) - 21:09, 19 May 2025

Cosegregation (section Heat maps)
each node. A heat map is a visual representation of a matrix of m × n that can show different phenomenons on a two-dimensional scale. Heat maps have a range...
25 KB (2,707 words) - 19:41, 5 May 2025

significance testing. There are two major ways of normalizing raw Hi-C contact heat maps. The first way is to assume equal visibility, meaning there is an equal...
49 KB (5,404 words) - 20:18, 2 November 2024
time, stats on user location, visits, and behavior on the site. Video heat maps show how user engagement rate changes through the viewing process in order...
17 KB (2,014 words) - 05:06, 21 May 2025

on drug use and previous criminal activity. Rosin instead relies on a heat map of crime created by Richard Janikowski and Phyllis Betts who is reported...
37 KB (4,527 words) - 01:50, 12 May 2025

background – Random background of gravitational waves permeating the Universe Heat death of the universe – Possible fate of the universe Horizons: Exploring...
108 KB (13,196 words) - 18:44, 19 May 2025
This is a partial list of temperature phenomena that have been labeled as heat waves, listed in order of occurrence. 1540 European drought - Extreme drought...
110 KB (12,481 words) - 05:18, 18 May 2025
Retrieved 14 May 2014. "Prix Pictet 2017: Richard Mosse wins prize with heat-map shots of refugees". The Guardian, 4 May 2017. Retrieved 5 May 2017 "Richard...
28 KB (2,335 words) - 04:29, 19 May 2025