
set terminal svg size 1000 1000 fixed enhanced fname "Nimbus Roman No9 L, Times, serif" fsize 36 set output "Function_arcsinx*arccosx^2.svg" set samples...
(900 × 1,000 (5 KB)) - 11:15, 8 September 2023

script: set terminal svg size 1000 1000 fixed enhanced fname "Nimbus Roman No9 L, Times, serif" fsize 36 set output "Function_x^3.svg" set samples 5000 set...
(912 × 1,000 (11 KB)) - 15:03, 1 September 2023

script: set terminal svg size 1000 1000 fixed enhanced fname "Nimbus Roman No9 L, Times, serif" fsize 36 set output "Function_x^3+1.svg" set samples 5000...
(916 × 1,000 (12 KB)) - 13:42, 26 April 2022

the hyphens to proper minus signs: sed -i 's/<text>-/<text>\xE2\x88\x92/g' Golden_function.svg English URL: https://commons.wikimedia.org/wiki/user:Qef Wikimedia...
(600 × 500 (14 KB)) - 09:18, 6 November 2020

function of a Tukey biweight function. It was created under R by the following code: f = function(x, c) { if (abs(x) < c) { return(x*((1-(x/c)^2))^2)...
(649 × 589 (50 KB)) - 21:09, 23 October 2024

I, the copyright holder of this work, hereby publish it under the following license: English L-Function of y^2=x^3+x^2-x...
(450 × 293 (37 KB)) - 00:21, 27 December 2023

{{Information |Description=Graph of function (4''x''3-6''x''2+1)sqrt(x+1) / (3-x) in [−1,1.5] square |Source=Produced by GNUPLOT 4.2 patchlevel 0 ; then curve replaced...
(800 × 800 (8 KB)) - 06:29, 28 November 2022

3)*unVec; X = (P0.*unMoinsT + 2*P1.*tMat).*unMoinsT + P2.*tMat.*tMat; endfunction function [f] = diffquadQ(P) X = bezierQ(P, t); x = X(1, :); ybez = X(2, :);...
(320 × 200 (1 KB)) - 05:31, 2 September 2020

f(x) = 1 - x + x² + x³ (function with 1 real and 2 imaginary roots)}} {{de|1=Graf der kubischen Funktion f(x) = 1 - x + x² + x³, erstellt mit GnuPlot}}...
(800 × 480 (35 KB)) - 14:08, 27 April 2024

the following script: set terminal svg size 1000 1000 fixed enhanced fname 'Times' fsize 36 set output "function-x.svg" set samples 10 set autoscale fix...
(1,000 × 1,000 (10 KB)) - 11:09, 7 August 2021

Langevin function only: Mplwp Langevin-function.svg Langevin function together with tanh(x/3): Mplwp Langevin-function tanhx3.svg I, the copyright holder...
(600 × 400 (35 KB)) - 10:56, 22 September 2020

10^{{{np.log10(x):.0f}}}$", lw=2) ax.legend(loc="upper left", fontsize="small") fig.tight_layout() fig.savefig("chapman_function.svg") English author...
(270 × 270 (28 KB)) - 01:48, 22 February 2024
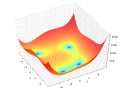
norm = LogNorm(), cmap = cm.jet) plt.xlabel("x") plt.ylabel("y") plt.savefig("Himmelblau function.svg") plt.show() English author name string: Morn the...
(720 × 540 (5.01 MB)) - 17:34, 18 February 2025
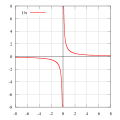
following script: set terminal svg size 1000 1000 fixed enhanced fname 'Times' fsize 36 set output "Function-1_x.svg" set samples 5000 set autoscale...
(1,304 × 1,308 (2 KB)) - 17:43, 26 June 2025

I, the copyright holder of this work, hereby publish it under the following license: English Function f(x) = (2*x^3+5*x^2+1)/(x^2+1) and its asymptote...
(620 × 695 (2 KB)) - 14:15, 17 February 2025

svg licensed with Cc-by-sa-3.0, GFDL 2008-06-10T22:09:37Z Geek3 520x220 (13725 Bytes) {{Information |Description={{en|1=Hyperbolic Secant function plot...
(520 × 520 (18 KB)) - 07:10, 17 April 2024
title= "Gauss function g(x)= 1/x - floor(1/x)", /* */ dimensions = [1000, 1000], yrange = [-0.1,1.1], xrange = [-0.1,1.1], xlabel = "x ", ylabel = "y"...
(1,000 × 1,000 (670 KB)) - 09:25, 30 September 2020

I, the copyright holder of this work, hereby publish it under the following license: English L-Function of y^2=x^3-4x+64...
(450 × 280 (36 KB)) - 00:21, 27 December 2023

I, the copyright holder of this work, hereby publish it under the following license: English L-Function of y^2=x^3-7x+10...
(450 × 293 (30 KB)) - 00:21, 27 December 2023

header('Content-type: image/svg+xml'); echo '<?xml version="1.0" encoding="utf-8" standalone="yes"?>'; function l($n, $m, $r=1) { for ($x = 1-$r; $x < 6; $x += 1) { echo...
(500 × 400 (2 KB)) - 10:25, 16 October 2024

I, the copyright holder of this work, hereby publish it under the following license: English L-Function of y^2=x^3-16x+16...
(450 × 293 (33 KB)) - 00:21, 27 December 2023

ncol = 2) x = rmvnorm(n, c(0, 0), sd) MyPlot(x) } } rotation <- function(t, X) return(X %*% matrix(c(cos(t), sin(t), -sin(t), cos(t)), ncol = 2)) RotNormal...
(1,260 × 575 (3.03 MB)) - 03:19, 23 April 2024

*unMoinsT... + P3.*tMat3; endfunction function [f] = diffquadC(P) X = bezierC(P, t); x = X(1, :); ybez = X(2, :); ytan = tan(x); difference = ybez-ytan; f = sum(difference...
(320 × 600 (1 KB)) - 13:11, 29 August 2020

odds <- function(p) p/(1 - p) e <- 1/10 # 'epsilon' fig <- ggplot(data.frame(p=c(0, 1)), aes(x=p)) + stat_function(fun=odds, size=1.0) + scale_x_continuous(limits=c(0+e...
(1,440 × 810 (40 KB)) - 12:05, 26 March 2025

the exponential function set key off set linestyle 1 lt 2 lc rgb "gray" lw 12 set grid back ls 1.5 plot (4*(x**3)-6*x*x+1)*sqrt(x+1)/(3-x) lc rgb "red"...
(600 × 600 (18 KB)) - 02:27, 7 September 2021

Radial Basis Function Interpolation Error.svg I, the copyright holder of this work, hereby publish it under the following license: This file is licensed...
(720 × 496 (82 KB)) - 02:42, 7 March 2022

Langevin function together with tanh(x/3): Mplwp Langevin-function tanhx3.svg I, the copyright holder of this work, hereby publish it under the following...
(600 × 400 (25 KB)) - 10:54, 22 September 2020

the similar work https://commons.wikimedia.org/wiki/File:Rosenbrock_function.svg , done by Morn the Gorn. Source code has been slightly modified into...
(720 × 540 (1.21 MB)) - 17:38, 10 August 2020

the following R code: x <- seq(-6,6,by=.1) y <- x^2 svg("figs/discontinuous_fx.svg", 5,5) par(mgp=c(2,.6,0), mar=c(3,3,3,1)) plot(x, y, type="l", xlab=""...
(450 × 450 (25 KB)) - 20:06, 29 October 2024

T:=(-Z+2-Z^-1)/4; TR<U>:=PowerSeriesRing(R); Pol<X>:=PolynomialRing(R); readi A,"What accuracy should the wavelets have?"; PolarFactorization:=function(A)...
(1,000 × 750 (10 KB)) - 17:03, 21 June 2024