
A tephigram is one of a number of thermodynamic diagrams commonly used in weather analysis and forecasting. The name evolved from the original name "T-...
3 KB (383 words) - 14:15, 10 May 2024

large angle between isotherms and dry adiabats, similar to that in the tephigram. It was thus more suitable for some of the newer analysis techniques being...
4 KB (403 words) - 12:45, 4 January 2024

1854 – 23 March 1945) was a British meteorologist. He introduced the tephigram, a diagram for evaluating convective instability in the atmosphere. He...
8 KB (728 words) - 09:51, 18 August 2023

Potential Energy (CAPE). Wind barbs are often plotted at the side of a tephigram to indicate the winds at different heights. First devised in 1884 by Heinrich...
2 KB (201 words) - 04:15, 24 January 2024
different types of thermodynamic diagrams used: Skew-T log-P diagram Tephigram Emagram All three diagrams are derived from the physical P–alpha diagram...
9 KB (1,235 words) - 19:26, 9 April 2024
"Observations". University of Manitoba. Retrieved 19 March 2016. "The evening tephigram from the region". University of Manitoba. Retrieved 19 March 2016. "Reflectivity...
32 KB (2,115 words) - 19:49, 2 March 2024
right corner. With the hodograph and thermodynamic diagrams like the tephigram, meteorologists can calculate: Wind shear: The lines uniting the extremities...
6 KB (803 words) - 04:40, 14 January 2024

(CAPE). This is why the three other thermodynamic diagrams (emagrams, tephigrams, and skew-T log-P diagrams) are most often preferred, the latter in the...
3 KB (289 words) - 22:33, 2 December 2023

format, plotted on thermodynamic diagrams such as Skew-T log-P diagrams, Tephigrams, and or Stüve diagrams, all useful for the interpretation of the atmosphere's...
27 KB (2,868 words) - 19:44, 12 May 2024

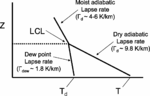
thermodynamic diagrams, examples of which include Skew-T log-P diagrams and tephigrams. (See also Thermals). The difference in moist adiabatic lapse rate and...
20 KB (2,402 words) - 09:33, 10 May 2024
used concept of equivalent temperature 1926 Sir Napier Shaw introduced tephigram 1933 Tor Bergeron published paper on "Physics of Clouds and Precipitation"...
13 KB (1,657 words) - 14:20, 21 November 2023
standard thermodynamic diagrams such as the skew-T log-P diagram or the tephigram. Nearly all of these formulations make use of the relationship between...
12 KB (2,019 words) - 17:32, 14 August 2023

length; the SI unit is kelvin per meter (K/m). temperature inversion tephigram terminal aerodrome forecast (TAF) A format for reporting current and forecast...
187 KB (21,500 words) - 07:32, 29 January 2024
(meteorology) temperature record temperature record of the past 1000 years tephigram The Weather Channel (TWC) The Weather Network thermal equator thermodynamic...
27 KB (2,808 words) - 13:06, 3 March 2024

organize the deep convection. Evaluation of the nearby upper air station tephigram showed a very strong convective available potential energy (CAPE) and...
14 KB (1,407 words) - 16:39, 3 April 2024
field Tensors in curvilinear coordinates Tensor–vector–scalar gravity Tephigram Terahertz band Terahertz metamaterials Terahertz radiation Terahertz spectroscopy...
19 KB (2,030 words) - 03:15, 22 April 2024

they are launched daily at 1100 NZT. The upper air data are displayed on tephigrams. A large range between 1 and 10 day forecasts are available, delivering...
3 KB (338 words) - 18:58, 5 February 2023