Histograms are most commonly used as visual representations of data. However, Database systems use histograms to summarize data internally and provide... 11 KB (1,677 words) - 20:05, 8 January 2024 |
Size of a Histogram Histograms: Theory and Practice, some great illustrations of some of the Bin Width concepts derived above. Histograms the Right Way... 26 KB (3,143 words) - 22:02, 3 May 2024 |
a histogram of gradient directions is compiled. The descriptor is the concatenation of these histograms. For improved accuracy, the local histograms can... 21 KB (2,870 words) - 07:41, 25 December 2023 |
List of statistics articles (section V) (statistics) Von Mises distribution Von Mises–Fisher distribution V-optimal histograms V-statistic Vuong's closeness test Vysochanskiï–Petunin inequality... 87 KB (8,290 words) - 14:04, 2 May 2024 |
neurophysiology, peristimulus time histogram and poststimulus time histogram, both abbreviated PSTH or PST histogram, are histograms of the times at which neurons... 3 KB (412 words) - 03:22, 2 April 2024 |
 | same precision as an optimal design. In practical terms, optimal experiments can reduce the costs of experimentation. The optimality of a design depends... 44 KB (4,402 words) - 08:09, 9 February 2024 |
metric W1 is widely used to compare discrete distributions, e.g. the color histograms of two digital images; see earth mover's distance for more details. In... 32 KB (5,169 words) - 14:21, 13 May 2024 |
of finding the optimal decision is a mathematical optimization problem. In practice, few people verify that their decisions are optimal, but instead use... 4 KB (699 words) - 14:46, 21 October 2023 |
Frequency (statistics) (section Histograms) Some of the graphs that can be used with frequency distributions are histograms, line charts, bar charts and pie charts. Frequency distributions are used... 13 KB (1,584 words) - 22:59, 5 February 2024 |
 | Image segmentation (redirect from Histogram-based methods for image segmentation) estimate of segmentation model can be formed. A general approach is to use histograms to represent the features of an image and proceed as outlined briefly... 74 KB (9,656 words) - 13:32, 8 May 2024 |
Bayesian experimental design (redirect from Optimal Bayesian experiment) also compared with classical average D-optimal design. It was shown that the Bayesian design is superior to D-optimal design. The Kelly criterion also describes... 11 KB (1,401 words) - 07:48, 28 January 2024 |
In statistics, Cramér's V (sometimes referred to as Cramér's phi and denoted as φc) is a measure of association between two nominal variables, giving... 7 KB (984 words) - 20:47, 28 March 2024 |
 | report). University of Queensland. Scott, D. (1979). "On optimal and data-based histograms". Biometrika. 66 (3): 605–610. doi:10.1093/biomet/66.3.605... 38 KB (4,572 words) - 18:52, 13 May 2024 |
1007/BF01025868. ISSN 0178-8051. S2CID 14437088. D.W. Scott (1979). "On optimal and data-based histograms". Biometrika. 66 (3): 605–610. doi:10.1093/biomet/66.3.605... 5 KB (633 words) - 05:29, 24 April 2024 |
the maximum (Bayes-optimal) discriminability index for two distributions, based on the amount of their overlap, i.e. the optimal (Bayes) error of classification... 10 KB (1,658 words) - 06:24, 31 January 2024 |
 | first English-language publication on an optimal design for regression models in 1876. A pioneering optimal design for polynomial regression was suggested... 42 KB (5,202 words) - 15:09, 3 April 2024 |
 | should be careful when using rough in-camera histogram approximations, particularly with live histograms, because they may fail to display small highlights... 19 KB (2,081 words) - 09:04, 11 December 2023 |
Zone System (section Histograms) The Zone System is a photographic technique for determining optimal film exposure and development, formulated by Ansel Adams and Fred Archer. Adams described... 31 KB (915 words) - 15:31, 23 September 2023 |
scientific hypothesis to test of its predictive adequacy. The use of optimal (or near optimal) designs reduces the cost of experimentation. Quality control and... 9 KB (1,000 words) - 15:48, 29 March 2024 |
V-statistics are a class of statistics named for Richard von Mises who developed their asymptotic distribution theory in a fundamental paper in 1947.... 9 KB (1,401 words) - 11:43, 30 January 2024 |
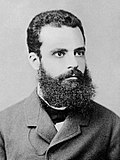 | Vilfredo Pareto (redirect from V. F. D. Pareto) perfectly competitive market creates distributions of wealth that are Pareto optimal. Some economic concepts in current use are based on his work: The Pareto... 32 KB (3,510 words) - 15:06, 9 May 2024 |
 | (75-75)=75^{\circ }F} Although box plots may seem more primitive than histograms or kernel density estimates, they do have a number of advantages. First... 20 KB (2,981 words) - 21:56, 11 May 2024 |
 | dynamical systems from measured data. System identification also includes the optimal design of experiments for efficiently generating informative data for fitting... 17 KB (2,237 words) - 08:16, 19 April 2024 |
against the optimal filter for the cubic sensor problem. The projection filter could track effectively bimodal densities of the optimal filter that would... 28 KB (5,095 words) - 14:50, 20 November 2023 |
vertical line, and the individual y values with symbols on the line. Unlike histograms, stem-and-leaf displays retain the original data to at least two significant... 8 KB (1,096 words) - 07:59, 22 September 2023 |
 | "Estimation and nonlinear optimal control: Particle resolution in filtering and estimation". Studies on: Filtering, optimal control, and maximum likelihood... 86 KB (9,816 words) - 16:27, 21 April 2024 |
addressing optimal optimal cost optimal hashing optimal merge optimal mismatch optimal polygon triangulation problem optimal polyphase merge optimal polyphase... 35 KB (3,134 words) - 05:03, 28 January 2024 |
Glossary of probability and statistics (section V) expectation is met. Contrast alternative hypothesis. opinion poll optimal decision optimal design outlier p-value pairwise independence A set of random variables... 34 KB (3,800 words) - 18:17, 6 May 2024 |
dimension, to multi-dimensional multi-resolution histograms. An advantage of these multi-resolution histograms is their ability to capture co-occurring features... 23 KB (2,644 words) - 13:10, 21 March 2024 |
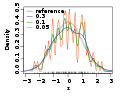
 | 2014): 215–249. doi:10.1016/j.sigpro.2013.12.026. An illustration of histograms and probability density functions Rosenblatt, M. (1956). "Remarks on Some... 9 KB (1,346 words) - 15:40, 18 April 2024 |