Part of the 1985 Irish local elections
1985 South Tipperary County Council election|
|
|
| |
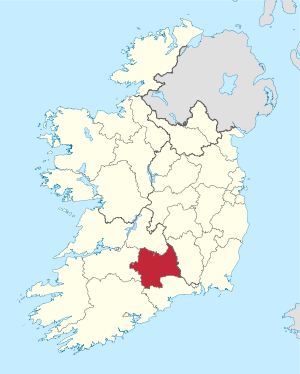 Map showing the area of South Tipperary County Council |
| | Council control after election
Fianna Fail
| |
An election to South Tipperary County Council took place on 20 June 1985 as part of the Irish local elections. 26 councillors were elected from five local electoral areas (LEAs) for a five-year term of office on the electoral system of proportional representation by means of the single transferable vote (PR-STV). This term was extended for a further year, to 1991.[1]
Results by local electoral area
[edit] Cahir: 5 seats | Party | Candidate | FPv% | Count |
| 1 | 2 | 3 | 4 | 5 | 6 | 7 | 8 | 9 |
| | Fianna Fáil | Seán Byrne TD* | | 1,447 | | | | | | | | |
| | Fianna Fáil | John Brennan* | | 947 | 1,049 | 1,063 | 1,071 | 1,094 | 1,146 | | | |
| | Fine Gael | Theresa Ahearn* | | 905 | 921 | 948 | 959 | 969 | 1,006 | 1,016 | 1,148 | |
| | Fianna Fáil | Con Donovan* | | 847 | 943 | 949 | 980 | 989 | 1,000 | 1,011 | 1,069 | 1,111 |
| | Fine Gael | Sean Sampson* | | 663 | 680 | 683 | 687 | 705 | 720 | 722 | 869 | 1,049 |
| | Fianna Fáil | Mattie McGrath | | 588 | 659 | 676 | 681 | 699 | 735 | 741 | 757 | 795 |
| | Fine Gael | John Arrigan | | 364 | 378 | 379 | 390 | 407 | 415 | 418 | | |
| | Labour | Eamonn Shine | | 257 | 263 | 267 | 280 | 302 | 418 | 425 | 443 | |
| | Labour | John O'Leary | | 246 | 253 | 268 | 285 | 296 | | | | |
| | Sinn Féin | Jimmy Maher | | 138 | 141 | 144 | 160 | | | | | |
| | Independent | Joe Meaney | | 116 | 121 | 130 | | | | | | |
| | Independent | Jim Cooney | | 98 | 105 | | | | | | | |
| Electorate: 9,700 Valid: 6,616 (69.04%) Spoilt: 83 Quota: 1,103 Turnout: 6,697 |
Cashel: 5 seats | Party | Candidate | FPv% | Count |
| 1 | 2 | 3 | 4 | 5 | 6 | 7 |
| | Fianna Fáil | Dr. Seán McCarthy TD* | | 1,486 | | | | | | |
| | Fine Gael | Jack Crowe* | | 1,116 | 1,142 | 1,209 | | | | |
| | Fine Gael | John Ryan* | | 766 | 776 | 780 | 806 | 890 | 1,019 | 1,164 |
| | Fianna Fáil | Timmy Hammersley* | | 743 | 787 | 801 | 919 | 928 | 1,083 | 1,217 |
| | Independent | John Bergin | | 637 | 653 | 679 | 702 | 754 | 772 | |
| | Fianna Fáil | Denis McInerney* | | 620 | 725 | 785 | 855 | 882 | 1,016 | 1,202 |
| | Fine Gael | Tom Wood | | 572 | 590 | 660 | 667 | 813 | 824 | 1,012 |
| | Fianna Fáil | John O'Grady | | 394 | 421 | 424 | 477 | 482 | | |
| | Fine Gael | Patrick Downey | | 312 | 315 | 332 | 338 | | | |
| | Workers' Party | Sean Hill | | 299 | 306 | | | | | |
| | Fianna Fáil | Kitty Barry | | 291 | 314 | 324 | | | | |
| Electorate: 9,788 Valid: 7,236 (74.58%) Spoilt: 64 Quota: 1,207 Turnout: 7,300 |
Clonmel: 5 seats | Party | Candidate | FPv% | Count |
| 1 | 2 | 3 | 4 | 5 |
| | Independent | Sean Treacy TD* | | 2,172 | | | | |
| | Fianna Fáil | Noel Davern | | 1,041 | 1,141 | 1,163 | 1,228 | 1,302 |
| | Fianna Fáil | Tom Ambrose* | | 950 | 1,038 | 1,058 | 1,119 | 1,243 |
| | Fine Gael | Johnny Kehoe | | 842 | 920 | 938 | 1,240 | 1,292 |
| | Fianna Fáil | Brendan Cronin | | 763 | 869 | 878 | 916 | 1,034 |
| | Labour | Sean Lyons* | | 683 | 984 | 1,040 | 1,109 | 1,328 |
| | Workers and Unemployed | Seamus Healy | | 535 | 667 | 682 | 719 | |
| | Fine Gael | Terence Darmody* | | 518 | 579 | 594 | | |
| | Labour | Mary-Ann Burke | | 132 | 165 | | | |
| Electorate: 10,807 Valid: 7,636 (71.21%) Spoilt: 60 Quota: 1,273 Turnout: 7,696 |
Fethard: 6 seats | Party | Candidate | FPv% | Count |
| 1 | 2 | 3 | 4 | 5 | 6 | 7 | 8 | 9 |
| | Fianna Fáil | Ned Meagher | | 1,464 | | | | | | | | |
| | Labour | Ned Brennan* | | 1,135 | 1,162 | 1,231 | 1,237 | 1,305 | | | | |
| | Fine Gael | John Holohan* | | 930 | 944 | 950 | 952 | 956 | 969 | 1,351 | | |
| | Fianna Fáil | Dick Tobin* | | 908 | 961 | 973 | 992 | 1,016 | 1,088 | 1,106 | 1,108 | 1,416 |
| | Fine Gael | Jimmy Hogan | | 785 | 786 | 790 | 843 | 953 | 1,082 | 1,168 | 1,184 | 1,205 |
| | Fianna Fáil | Denis Bourke* | | 759 | 773 | 779 | 810 | 863 | 991 | 998 | 998 | 1,270 |
| | Fine Gael | Sean Clancy | | 653 | 663 | 672 | 673 | 676 | 687 | | | |
| | Fianna Fáil | Joe Aherne | | 644 | 677 | 687 | 691 | 698 | 734 | 763 | 765 | |
| | Fine Gael | James Murphy* | | 630 | 631 | 635 | 651 | 676 | 701 | 785 | 812 | 842 |
| | Sinn Féin | Eddie O'Doherty | | 461 | 463 | 492 | 524 | 592 | | | | |
| | Labour | David Drohan* | | 367 | 367 | 369 | 401 | | | | | |
| | Independent | Dick Joy | | 215 | 215 | 217 | 380 | | | | | |
| | Workers' Party | Michael Langton | | 178 | 181 | | | | | | | |
| Electorate: 12,778 Valid: 9,127 (72.34%) Spoilt: 87 Quota: 1,304 Turnout: 9,244 |
Tipperary: 5 seats | Party | Candidate | FPv% | Count |
| 1 | 2 | 3 | 4 | 5 | 6 | 7 |
| | Labour | Michael Ferris* | | 1,564 | | | | | | |
| | Fianna Fáil | William Ryan* | | 1,080 | 1,127 | 1,140 | 1,184 | 1,221 | | |
| | Fine Gael | Michael Fitzgerald* | | 854 | 920 | 955 | 981 | 1,154 | 1,591 | |
| | Fianna Fáil | Josephine Quinlan* | | 830 | 865 | 877 | 928 | 954 | 1,021 | 1,094 |
| | Fianna Fáil | Michael Maguire | | 735 | 774 | 788 | 832 | 861 | 1,049 | 1,136 |
| | Workers' Party | Christy Kinahan | | 636 | 680 | 748 | 850 | 881 | 896 | 916 |
| | Fine Gael | P.J. Maher* | | 607 | 633 | 640 | 646 | 786 | | |
| | Fine Gael | Denis Leahy | | 415 | 441 | 452 | 465 | | | |
| | Sinn Féin | Finbarr Kissane | | 302 | 324 | 342 | | | | |
| | Labour | Paddy Cummins | | 134 | 200 | | | | | |
| Electorate: 10,716 Valid: 7,157 (67.7%) Spoilt: 98 Quota: 1,193 Turnout: 7,255 |

 French
 Deutsch