2014 United States Senate elections
| ||||||||||||||||||||||||||||||||||||||||||||||||||||||||||||||||||||
36 of the 100 seats in the United States Senate 51 seats needed for a majority | ||||||||||||||||||||||||||||||||||||||||||||||||||||||||||||||||||||
|---|---|---|---|---|---|---|---|---|---|---|---|---|---|---|---|---|---|---|---|---|---|---|---|---|---|---|---|---|---|---|---|---|---|---|---|---|---|---|---|---|---|---|---|---|---|---|---|---|---|---|---|---|---|---|---|---|---|---|---|---|---|---|---|---|---|---|---|---|
| ||||||||||||||||||||||||||||||||||||||||||||||||||||||||||||||||||||
 | ||||||||||||||||||||||||||||||||||||||||||||||||||||||||||||||||||||
The 2014 United States Senate elections were held on November 4, 2014. A total of 36 seats in the 100-member U.S. Senate were contested. Thirty-three Class 2 seats were contested for regular six-year terms to be served from January 3, 2015, to January 3, 2021, and three Class 3 seats were contested in special elections due to Senate vacancies. The elections marked 100 years of direct elections of U.S. senators. Going into the elections, 21 of the contested seats were held by the Democratic Party, while 15 were held by the Republican Party.
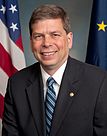
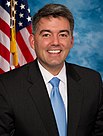
The Republicans regained the majority of the Senate in the 114th Congress, which started in January 2015; the Republicans had not controlled the Senate since January 2007. They needed a net gain of at least six seats to obtain a majority and were projected by polls to do so. On election night, they held all of their seats and gained nine Democratic-held seats. Republicans defeated five Democratic incumbents: Mark Begich of Alaska lost to Dan Sullivan, Mark Pryor of Arkansas lost to Tom Cotton, Mark Udall of Colorado lost to Cory Gardner, Mary Landrieu of Louisiana lost to Bill Cassidy, and Kay Hagan of North Carolina lost to Thom Tillis. Republicans also picked up another four open seats in Iowa, Montana, South Dakota, and West Virginia that were previously held by Democrats. Democrats did not pick up any Republican-held seats, but they did hold an open seat in Michigan.
This was the second consecutive election cycle held in a president's sixth year where control of the Senate changed hands, the first being in 2006. This was also the first time that the Democrats lost control of the Senate in a sixth-year midterm election cycle since 1918. With a total net gain of nine seats, the Republicans made the largest Senate gain by any party since 1980. This is also the first election cycle since 1980 in which more than two incumbent Democratic senators were defeated by their Republican challengers.[2] Days after the election cycle, the United States Election Project estimated that 36.4% of eligible voters voted, 4% lower than the 2010 elections, and possibly the lowest turnout rate since the 1942 election cycle.[3][4]
As of 2022, this remains the last time that a Republican has won a U.S. Senate election in Colorado. This is the most recent Senate election where any Republican flipped an open Democratic-held seat. It also remains the last time that the president's party has suffered a net loss of Senate seats in a midterm election cycle, and the last Senate election cycle to not have either of Arizona's seats up for election.
Partisan composition[edit]
For a majority, Republicans needed at least 51 seats. Democrats could have retained a majority with 48 seats (assuming the two Independents continued to caucus with them) because the Democratic Vice President Joe Biden would become the tie-breaker. From 1915 to 2013, control of the U.S. Senate flipped in 10 of 50 cycles, or 20% of the time.[5] Republicans had lost ground in the 2012 elections, leading to an internal fight among the Republican leadership over the best strategies and tactics for the 2014 Senate races.[6] By December 2013, eight of the twelve incumbent Republicans running for re-election saw Tea Party challenges.[7] However, Republican incumbents won every primary challenge.[8] Although Democrats saw some opportunities for pickups, the combination of Democratic retirements and numerous Democratic seats up for election in swing states and red states gave Republicans hopes of taking control of the Senate.[9] 7 of the 21 states with Democratic seats up for election in 2014 had voted for Republican Mitt Romney in the 2012 presidential election compared to just 1 state with a Republican senator that voted for Barack Obama. Democrats also faced the lower voter turnout that accompanies mid-term elections.[10]
Poll aggregation website FiveThirtyEight gave the Republican Party a 60% chance of taking control of the Senate as of September 28.[11] Another poll aggregation website, RealClearPolitics, gave the Republican Party a net gain of 7 seats.[12] Due to the closeness of several races, it was initially believed that Senate control might not be decided on election night.[13] Both Louisiana and Georgia were seen as competitive, and both states require a run-off election if no candidate takes a majority of the vote.
Two independent candidates (in Kansas and South Dakota[14]) refused to commit to caucusing with either party.[13] In the final months of the race, polls showed them with viable chances of winning, leading some analysts to speculate on the possibility of an "Independent caucus" that could also include Maine Senator Angus King and possibly Vermont Senator Bernie Sanders.[15][16] However, no Independent won a Senate race in 2014, and King and Sanders continue to caucus with the Democratic Party following the 2014 election cycle.
By midnight ET, most major networks projected that the Republicans would take control of the Senate. The party held all three competitive Republican-held seats (Kentucky, Kansas, and Georgia), and defeated incumbent Democrats in North Carolina, Colorado, and Arkansas. Combined with the pick-ups of open seats in Iowa, Montana, South Dakota, and West Virginia, the Republicans made a net gain of 7 seats before the end of the night. Republicans defeated three incumbent Democrats, a task the party had not accomplished since the 1980 election cycle.[17] Five of the seven confirmed pickups were in states that voted for Mitt Romney in 2012, but two of the seats that Republicans won represent states that voted for Barack Obama in 2012 (Colorado and Iowa). Of the three races that were not called by the end of election night, Alaska and Virginia were still too close to call, while Louisiana held a December 6 run-off election. Virginia declared Democrat Mark Warner the winner of his race by a narrow margin over Republican Ed Gillespie on November 7, and Alaska declared Dan Sullivan the winner against Democratic incumbent Mark Begich a week later, on November 12. Republican Bill Cassidy defeated Democratic incumbent Mary Landrieu in the Louisiana runoff on December 6.
Election spending[edit]
Altogether, at least $3.67 billion was spent by candidates, parties, committees and outside groups in the 2014 election cycle.[18][19] Spending on the 2014 Senate elections by outside groups (i.e., organizations other than a candidate's campaign, such as super PACs and "dark money" nonprofit groups) more than doubled from 2010. In the 10 competitive races for which data was available, outside groups accounted for 47% of spending, candidates accounted for 41% of spending, and parties accounted for 12% of spending.[20] The Senate race with the most outside spending was in North Carolina, at $80 million, a new record.[20]
The top outside spenders in the 11 most competitive Senate races were the following:
- On the Republican side, the National Republican Senatorial Committee, Crossroads GPS, U.S. Chamber of Commerce, Ending Spending Action Fund, Freedom Partners Action Fund, American Crossroads, and the NRA Political Victory Fund.[20]
- On the Democratic side, the Democratic Senatorial Campaign Committee, Senate Majority PAC, and NextGen Climate Action Committee.[20]
Results summary[edit]
The Republican Party made a net gain of nine U.S. Senate seats in the 2014 elections.[21]
Going into the elections, there were 53 Democratic, 45 Republican and 2 independent senators (both of whom caucus with the Democrats). In all, there were 36 elections: 33 senators were up for election this year as class 2 senators, and 3 faced special elections (all from Class 3). Of all these seats, 21 were held by Democrats and 15 were held by Republicans.
| 44 | 2 | 54 |
| Democratic | Independent | Republican |
Colored shading indicates party with largest share of that row.
| Parties | Total | ||||||||||||||||||||||||||||||||||||||||||||||||||||||||||||||||||||||||||||||||||||||||||||||||||
|---|---|---|---|---|---|---|---|---|---|---|---|---|---|---|---|---|---|---|---|---|---|---|---|---|---|---|---|---|---|---|---|---|---|---|---|---|---|---|---|---|---|---|---|---|---|---|---|---|---|---|---|---|---|---|---|---|---|---|---|---|---|---|---|---|---|---|---|---|---|---|---|---|---|---|---|---|---|---|---|---|---|---|---|---|---|---|---|---|---|---|---|---|---|---|---|---|---|---|---|
| Democratic | Republican | Independent | Libertarian | Green | Other | ||||||||||||||||||||||||||||||||||||||||||||||||||||||||||||||||||||||||||||||||||||||||||||||
| Before these elections | 53 | 45 | 2 | — | — | — | 100 | ||||||||||||||||||||||||||||||||||||||||||||||||||||||||||||||||||||||||||||||||||||||||||||
| Not up | 32 | 30 | 2 | — | — | — | 64 | ||||||||||||||||||||||||||||||||||||||||||||||||||||||||||||||||||||||||||||||||||||||||||||
| Class 1 (2012→2018) | 23 | 8 | 2 | — | — | — | 33 | ||||||||||||||||||||||||||||||||||||||||||||||||||||||||||||||||||||||||||||||||||||||||||||
| Class 3 (2010→2016) | 9 | 22 | — | — | — | — | 31 | ||||||||||||||||||||||||||||||||||||||||||||||||||||||||||||||||||||||||||||||||||||||||||||
| Up | 21 | 15 | — | — | — | — | 36 | ||||||||||||||||||||||||||||||||||||||||||||||||||||||||||||||||||||||||||||||||||||||||||||
| General: Class 2 | 20 | 13 | — | — | — | — | 33 | ||||||||||||||||||||||||||||||||||||||||||||||||||||||||||||||||||||||||||||||||||||||||||||
| Special: Class 3 | 1 | 2 | — | — | — | — | 3 | ||||||||||||||||||||||||||||||||||||||||||||||||||||||||||||||||||||||||||||||||||||||||||||
| Incumbent retired | 4 | 3[b] | — | — | — | — | 7 | ||||||||||||||||||||||||||||||||||||||||||||||||||||||||||||||||||||||||||||||||||||||||||||
| Held by same party | 1 | 3 | — | — | — | — | 4 | ||||||||||||||||||||||||||||||||||||||||||||||||||||||||||||||||||||||||||||||||||||||||||||
| Replaced by other party | — | — | — | — | 3 | ||||||||||||||||||||||||||||||||||||||||||||||||||||||||||||||||||||||||||||||||||||||||||||||
| Result | 1 | 6 | — | — | — | — | 7 | ||||||||||||||||||||||||||||||||||||||||||||||||||||||||||||||||||||||||||||||||||||||||||||
| Incumbent ran | 17[c][d] | 12[c] | — | — | — | — | 29 | ||||||||||||||||||||||||||||||||||||||||||||||||||||||||||||||||||||||||||||||||||||||||||||
| Won election | 11[e] | 12[e] | — | — | — | — | 23 | ||||||||||||||||||||||||||||||||||||||||||||||||||||||||||||||||||||||||||||||||||||||||||||
| Lost re-election | — | — | — | — | 5 | ||||||||||||||||||||||||||||||||||||||||||||||||||||||||||||||||||||||||||||||||||||||||||||||
| Lost renomination but held by same party | — | — | — | — | — | — | 0 | ||||||||||||||||||||||||||||||||||||||||||||||||||||||||||||||||||||||||||||||||||||||||||||
| Withdrew from nomination and party lost | — | — | — | — | 1 | ||||||||||||||||||||||||||||||||||||||||||||||||||||||||||||||||||||||||||||||||||||||||||||||
| Result | 11 | 18 | — | — | — | — | 29 | ||||||||||||||||||||||||||||||||||||||||||||||||||||||||||||||||||||||||||||||||||||||||||||
| Total elected | 12 | 24 | 0 | — | — | — | 36 | ||||||||||||||||||||||||||||||||||||||||||||||||||||||||||||||||||||||||||||||||||||||||||||
| Net gain/loss | — | — | — | — | 9 | ||||||||||||||||||||||||||||||||||||||||||||||||||||||||||||||||||||||||||||||||||||||||||||||
| Nationwide vote | 19,786,883 | 23,253,636 | 698,161 | 879,722 | 152,703 | 394,075 | 45,165,180 | ||||||||||||||||||||||||||||||||||||||||||||||||||||||||||||||||||||||||||||||||||||||||||||
| Share | 43.81% | 51.49% | 1.55% | 1.95% | 0.34% | 0.87% | 100% | ||||||||||||||||||||||||||||||||||||||||||||||||||||||||||||||||||||||||||||||||||||||||||||
| Result | 44 | 54 | 2 | — | — | — | 100 | ||||||||||||||||||||||||||||||||||||||||||||||||||||||||||||||||||||||||||||||||||||||||||||
Source: Clerk of the U.S. House of Representatives[1]
Change in composition[edit]
Before the elections[edit]
| D1 | D2 | D3 | D4 | D5 | D6 | D7 | D8 | D9 | D10 |
| D20 | D19 | D18 | D17 | D16 | D15 | D14 | D13 | D12 | D11 |
| D21 | D22 | D23 | D24 | D25 | D26 | D27 | D28 | D29 | D30 |
| D40 La. Ran | D39 Iowa Retired | D38 Ill. Ran | D37 Hawaii (sp) Ran | D36 Del. Ran | D35 Colo. Ran | D34 Ark. Ran | D33 Alaska Ran | D32 | D31 |
| D41 Mass. Ran | D42 Mich. Retired | D43 Minn. Ran | D44 Mont. Withdrew | D45 N.H. Ran | D46 N.J. Ran | D47 N.M. Ran | D48 N.C. Ran | D49 Ore. Ran | D50 R.I. Ran |
| Majority→ | D51 S.D. Retired | ||||||||
| R41 S.C. (reg) Ran | R42 S.C. (sp) Ran | R43 Tenn. Ran | R44 Texas Ran | R45 Wyo. Ran | I1 | I2 | D53 W.Va. Retired | D52 Va. Ran | |
| R40 Okla. (sp) Resigned | R39 Okla. (reg) Ran | R38 Neb. Retired | R37 Miss. Ran | R36 Me. Ran | R35 Ky. Ran | R34 Kan. Ran | R33 Idaho Ran | R32 Ga. Retired | R31 Ala. Ran |
| R21 | R22 | R23 | R24 | R25 | R26 | R27 | R28 | R29 | R30 |
| R20 | R19 | R18 | R17 | R16 | R15 | R14 | R13 | R12 | R11 |
| R1 | R2 | R3 | R4 | R5 | R6 | R7 | R8 | R9 | R10 |
After the elections[edit]
| D1 | D2 | D3 | D4 | D5 | D6 | D7 | D8 | D9 | D10 |
| D20 | D19 | D18 | D17 | D16 | D15 | D14 | D13 | D12 | D11 |
| D21 | D22 | D23 | D24 | D25 | D26 | D27 | D28 | D29 | D30 |
| D40 N.J. Re-elected | D39 N.H. Re-elected | D38 Minn. Re-elected | D37 Mich. Hold | D36 Mass. Re-elected | D35 Ill. Re-elected | D34 Hawaii (sp) Elected[f] | D33 Del. Re-elected | D32 | D31 |
| D41 N.M. Re-elected | D42 Ore. Re-elected | D43 R.I. Re-elected | D44 Va. Re-elected | I1 | I2 | R54 W.Va. Gain | R53 S.D. Gain | R52 N.C. Gain | R51 Mont. Gain |
| Majority → | |||||||||
| R41 S.C. (reg) Re-elected | R42 S.C. (sp) Elected[f] | R43 Tenn. Re-elected | R44 Texas Re-elected | R45 Wyo. Re-elected | R46 Alaska Gain | R47 Ark. Gain | R48 Colo. Gain | R49 Iowa Gain | R50 La. Gain |
| R40 Okla. (sp) Hold | R39 Okla. (reg) Re-elected | R38 Neb. Hold | R37 Miss. Re-elected | R36 Me. Re-elected | R35 Ky. Re-elected | R34 Kan. Re-elected | R33 Idaho Re-elected | R32 Ga. Hold | R31 Ala. Re-elected |
| R21 | R22 | R23 | R24 | R25 | R26 | R27 | R28 | R29 | R30 |
| R20 | R19 | R18 | R17 | R16 | R15 | R14 | R13 | R12 | R11 |
| R1 | R2 | R3 | R4 | R5 | R6 | R7 | R8 | R9 | R10 |
| Key: |
|
|---|
Gains and losses[edit]
Retirements[edit]
Four Democrats and two Republicans retired instead of seeking re-election. Max Baucus of Montana announced his intent to retire at the end of his term, but he resigned on February 6, 2014, after being appointed as the United States Ambassador to China. John Walsh, who was appointed by Montana governor Steve Bullock to finish Baucus's term, later withdrew to run for a full term (see Nomination withdrawn section below).
Resignations[edit]
One Republican resigned four years into his six-year term.
| State | Senator | Replaced by |
|---|---|---|
| Oklahoma (special) | Tom Coburn | James Lankford |
Nomination withdrawn[edit]
One Democrat was originally to seek election for a full 6-year term in office but withdrew.
| State | Senator | Replaced by |
|---|---|---|
| Montana | John Walsh | Steve Daines |
Defeats[edit]
Five Democrats sought re-election but lost in the general election.
| State | Senator | Replaced by |
|---|---|---|
| Alaska | Mark Begich | Dan Sullivan |
| Arkansas | Mark Pryor | Tom Cotton |
| Colorado | Mark Udall | Cory Gardner |
| Louisiana | Mary Landrieu | Bill Cassidy |
| North Carolina | Kay Hagan | Thom Tillis |
Race summaries[edit]
Special elections during the preceding Congress[edit]
In these special elections, the winners were elected during 2014 and seated before January 3, 2015 — except that one was seated on January 3, 2015, the effective date of the predecessor's resignation.
| State (linked to summaries below) | Incumbent | Results | Candidates | ||
|---|---|---|---|---|---|
| Senator | Party | Electoral history | |||
| Hawaii (Class 3) | Brian Schatz | Democratic | 2012 (Appointed) | Interim appointee elected. |
|
| Oklahoma (Class 3) | Tom Coburn | Republican | 2004 2010 | Incumbent resigned, effective January 3, 2015. New senator elected. Republican hold. |
|
| South Carolina (Class 3) | Tim Scott | Republican | 2013 (Appointed) | Interim appointee elected. |
|
Elections leading to the next Congress[edit]
In these general elections, the winners were elected for the term beginning January 3, 2015; ordered by state.
All of the elections involved the Class 2 seats.
| State (linked to summaries below) | Incumbent | Results[24] | Candidates | ||
|---|---|---|---|---|---|
| Senator | Party | Electoral history | |||
| Alabama | Jeff Sessions | Republican | 1996 2002 2008 | Incumbent re-elected. |
|
| Alaska | Mark Begich | Democratic | 2008 | Incumbent lost re-election. New senator elected. Republican gain.[25] |
|
| Arkansas | Mark Pryor | Democratic | 2002 2008 | Incumbent lost re-election. New senator elected. Republican gain. |
|
| Colorado | Mark Udall | Democratic | 2008 | Incumbent lost re-election. New senator elected. Republican gain. |
|
| Delaware | Chris Coons | Democratic | 2010 (special) | Incumbent re-elected. |
|
| Georgia | Saxby Chambliss | Republican | 2002 2008 | Incumbent retired.[26] New senator elected. Republican hold. |
|
| Idaho | Jim Risch | Republican | 2008 | Incumbent re-elected. |
|
| Illinois | Dick Durbin | Democratic | 1996 2002 2008 | Incumbent re-elected. |
|
| Iowa | Tom Harkin | Democratic | 1984 1990 1996 2002 2008 | Incumbent retired.[27] New senator elected. Republican gain. |
Others
|
| Kansas | Pat Roberts | Republican | 1996 2002 2008 | Incumbent re-elected. |
|
| Kentucky | Mitch McConnell | Republican | 1984 1990 1996 2002 2008 | Incumbent re-elected. |
|
| Louisiana | Mary Landrieu | Democratic | 1996 2002 2008 | Incumbent lost re-election in runoff. New senator elected. Republican gain. |
|
| Maine | Susan Collins | Republican | 1996 2002 2008 | Incumbent re-elected. |
|
| Massachusetts | Ed Markey | Democratic | 2013 (special) | Incumbent re-elected. |
|
| Michigan | Carl Levin | Democratic | 1978 1984 1990 1996 2002 2008 | Incumbent retired.[28] New senator elected. Democratic hold. |
|
| Minnesota | Al Franken | DFL | 2008 | Incumbent re-elected. |
|
| Mississippi | Thad Cochran | Republican | 1978 1984 1990 1996 2002 2008 | Incumbent re-elected. |
|
| Montana | John Walsh | Democratic | 2014 (Appointed) | Interim appointee nominated but withdrew. New senator elected. Republican gain. |
|
| Nebraska | Mike Johanns | Republican | 2008 | Incumbent retired.[31] New senator elected. Republican hold. |
|
| New Hampshire | Jeanne Shaheen | Democratic | 2008 | Incumbent re-elected. |
|
| New Jersey | Cory Booker | Democratic | 2013 (special) | Incumbent re-elected. |
Others
|
| New Mexico | Tom Udall | Democratic | 2008 | Incumbent re-elected. | |
| North Carolina | Kay Hagan | Democratic | 2008 | Incumbent lost re-election. New senator elected. Republican gain. |
|
| Oklahoma | Jim Inhofe | Republican | 1994 1996 2002 2008 | Incumbent re-elected. |
|
| Oregon | Jeff Merkley | Democratic | 2008 | Incumbent re-elected. |
|
| Rhode Island | Jack Reed | Democratic | 1996 2002 2008 | Incumbent re-elected. |
|
| South Carolina | Lindsey Graham | Republican | 2002 2008 | Incumbent re-elected. |
|
| South Dakota | Tim Johnson | Democratic | 1996 2002 2008 | Incumbent retired.[32] New senator elected. Republican gain. |
|
| Tennessee | Lamar Alexander | Republican | 2002 2008 | Incumbent re-elected. |
Others
|
| Texas | John Cornyn | Republican | 2002 2002 (Appointed) 2008 | Incumbent re-elected. |
|
| Virginia | Mark Warner | Democratic | 2008 | Incumbent re-elected. |
|
| West Virginia | Jay Rockefeller | Democratic | 1984 1990 1996 2002 2008 | Incumbent retired.[34] New senator elected. Republican gain. |
|
| Wyoming | Mike Enzi | Republican | 1996 2002 2008 | Incumbent re-elected. |
|
Closest races[edit]
In seven races the margin of victory was under 10%.
| District | Winner | Margin |
|---|---|---|
| Virginia | Democratic | 0.8% |
| North Carolina | Republican (flip) | 1.5% |
| Colorado | Republican (flip) | 1.9% |
| Alaska | Republican (flip) | 2.2% |
| New Hampshire | Democratic | 3.3% |
| Georgia | Republican | 7.7%[g] |
| Iowa | Republican (flip) | 8.3% |
Final pre-election predictions[edit]

Safe Democratic seat Competitive Democratic-held seat
Safe Republican seat Competitive Republican-held seat
Predicted probability of Republican takeover[edit]
Several websites used poll aggregation and psephology to estimate the probability that the Republican Party would gain enough seats to take control of the Senate.
| Source | Probability of Republican control | Updated |
|---|---|---|
| FiveThirtyEight | 76.2%[36] | Nov 4 |
| Princeton Election Consortium (Sam Wang) | 65%[37] | Nov 3 |
| Huffington Post | 79%[38] | Nov 3 |
| The Upshot (The New York Times) | 70%[39] | Nov 3 |
| The Washington Post | 97%[40] | Nov 3 |
| Daily Kos | 90%[41] | Nov 4 |
Predictions[edit]
Republicans needed to win at least six in order to gain a majority of 51 seats and Democrats needed to win at least seven in order to hold a majority of 50 seats (including the two independents who currently caucus with the Democrats) and the tie-breaking vote of Vice President Joe Biden.
| State | PVI | Incumbent | Last election[h] | Cook Oct. 29, 2014[42] | Daily Kos Nov. 3, 2014[43] | 538 Oct. 29, 2014[44] | NYT Oct. 29, 2014[45] | RCP Oct. 29, 2014[46] | Rothenberg Oct. 29, 2014[47] | Sabato Oct. 29, 2014[48] | Jay DeSart Oct. 28, 2014[49] | Winner |
|---|---|---|---|---|---|---|---|---|---|---|---|---|
| Alabama | R+14 | Jeff Sessions | 63.4% | Safe R | Safe R | Safe R | Safe R | Safe R | Safe R | Safe R | Safe R | Sessions (97.3%) |
| Alaska | R+12 | Mark Begich | 47.8% | Tossup | Likely R (flip) | Lean R (flip) | Lean R (flip) | Tossup | Tilt R (flip) | Lean R (flip) | Lean R (flip) | Sullivan (48.0%) (flip) |
| Arkansas | R+14 | Mark Pryor | 79.5% | Tossup | Safe R (flip) | Safe R (flip) | Likely R (flip) | Lean R (flip) | Lean R (flip) | Likely R (flip) | Lean R (flip) | Cotton (56.5%) (flip) |
| Colorado | D+1 | Mark Udall | 52.8% | Tossup | Likely R (flip) | Likely R (flip) | Likely R (flip) | Tossup | Tilt R (flip) | Lean R (flip) | Lean R (flip) | Gardner (48.2%) (flip) |
| Delaware | D+8 | Chris Coons | 56.6% (2010 special)[i] | Safe D | Safe D | Safe D | Safe D | Safe D | Safe D | Safe D | Safe D | Coons (55.8%) |
| Georgia | R+6 | Saxby Chambliss (retiring) | 57.4% | Tossup | Safe R | Likely R | Lean R | Tossup | Tossup | Lean R | Lean R | Perdue (52.9%) |
| Hawaii (special) | D+20 | Brian Schatz | Appointed (2012)[j] | Safe D | Safe D | Safe D | Safe D | Safe D | Safe D | Safe D | Safe D | Schatz (69.8%) |
| Idaho | R+18 | Jim Risch | 57.7% | Safe R | Safe R | Safe R | Safe R | Safe R | Safe R | Safe R | Safe R | Risch (65.3%) |
| Illinois | D+8 | Dick Durbin | 67.8% | Safe D | Safe D | Safe D | Safe D | Likely D | Safe D | Safe D | Safe D | Durbin (53.5%) |
| Iowa | D+1 | Tom Harkin (retiring) | 62.7% | Tossup | Likely R (flip) | Likely R (flip) | Lean R (flip) | Tossup | Tossup | Lean R (flip) | Lean R (flip) | Ernst (52.1%) (flip) |
| Kansas | R+12 | Pat Roberts | 60.1% | Tossup | Safe R | Lean I (flip) | Tossup | Tossup | Tossup | Lean R | Tossup | Roberts (53.1%) |
| Kentucky | R+13 | Mitch McConnell | 53.0% | Lean R | Safe R | Safe R | Safe R | Lean R | Likely R | Likely R | Likely R | McConnell (56.2%) |
| Louisiana | R+12 | Mary Landrieu | 52.1% | Lean R (flip) | Likely R (flip) | Likely R (flip) | Likely R (flip) | Likely R (flip) | Lean R (flip) | Safe R (flip) | Likely R (flip) | Cassidy (55.9%) (flip) |
| Maine | D+6 | Susan Collins | 61.3% | Safe R | Safe R | Safe R | Safe R | Safe R | Safe R | Safe R | Safe R | Collins (68.5%) |
| Massachusetts | D+10 | Ed Markey | 54.8% (2013 special)[k] | Safe D | Safe D | Safe D | Safe D | Safe D | Safe D | Safe D | Safe D | Markey (61.9%) |
| Michigan | D+4 | Carl Levin (retiring) | 62.7% | Lean D | Safe D | Safe D | Safe D | Safe D | Likely D | Likely D | Safe D | Peters (54.6%) |
| Minnesota | D+2 | Al Franken | 41.99% | Likely D | Safe D | Safe D | Safe D | Likely D | Likely D | Likely D | Safe D | Franken (53.2%) |
| Mississippi | R+9 | Thad Cochran | 61.4% | Likely R | Safe R | Safe R | Safe R | Likely R | Safe R | Safe R | Safe R | Cochran (59.9%) |
| Montana | R+7 | John Walsh (withdrew) | Appointed (2014)[l] | Safe R (flip) | Safe R (flip) | Safe R (flip) | Safe R (flip) | Safe R (flip) | Safe R (flip) | Safe R (flip) | Safe R (flip) | Daines (57.8%) (flip) |
| Nebraska | R+12 | Mike Johanns (retiring) | 57.5% | Safe R | Safe R | Safe R | Safe R | Safe R | Safe R | Safe R | Safe R | Sasse (64.5%) |
| New Hampshire | D+1 | Jeanne Shaheen | 51.6% | Tossup | Tilt D | Likely D | Lean D | Tossup | Tilt D | Lean D | Tilt D | Shaheen (51.6%) |
| New Jersey | D+6 | Cory Booker | 54.9% (2013 special)[m] | Safe D | Safe D | Safe D | Safe D | Likely D | Safe D | Safe D | Safe D | Booker (55.8%) |
| New Mexico | D+4 | Tom Udall | 61.3% | Safe D | Safe D | Safe D | Safe D | Likely D | Safe D | Safe D | Safe D | Udall (55.6%) |
| North Carolina | R+3 | Kay Hagan | 52.7% | Tossup | Tossup | Lean D | Lean D | Tossup | Tossup | Lean D | Tossup | Tillis (48.8%) (flip) |
| Oklahoma (regular) | R+19 | Jim Inhofe | 56.7% | Safe R | Safe R | Safe R | Safe R | Safe R | Safe R | Safe R | Safe R | Inhofe (68.0%) |
| Oklahoma (special) | R+19 | Tom Coburn (retiring) | 70.6% (2010) | Safe R | Safe R | Safe R | Safe R | Safe R | Safe R | Safe R | Safe R | Lankford (67.9%) |
| Oregon | D+5 | Jeff Merkley | 48.9% | Likely D | Safe D | Safe D | Safe D | Likely D | Likely D | Likely D | Safe D | Merkley (55.7%) |
| Rhode Island | D+11 | Jack Reed | 73.4% | Safe D | Safe D | Safe D | Safe D | Safe D | Safe D | Safe D | Safe D | Reed (70.6%) |
| South Carolina (regular) | R+8 | Lindsey Graham | 57.5% | Safe R | Safe R | Safe R | Safe R | Safe R | Safe R | Safe R | Safe R | Graham (55.3%) |
| South Carolina special) | R+8 | Tim Scott | Appointed (2013)[n] | Safe R | Safe R | Safe R | Safe R | Safe R | Safe R | Safe R | Safe R | Scott (61.1%) |
| South Dakota | R+10 | Tim Johnson (retiring) | 62.5% | Lean R (flip) | Likely R (flip) | Safe R (flip) | Safe R (flip) | Likely R (flip) | Likely R (flip) | Likely R (flip) | Safe R (flip) | Rounds (50.4%) (flip) |
| Tennessee | R+12 | Lamar Alexander | 65.14% | Safe R | Safe R | SafeR | Safe R | Safe R | Safe R | Safe R | Safe R | Alexander (61.9%) |
| Texas | R+10 | John Cornyn | 54.8% | Safe R | Safe R | Safe R | Safe R | Safe R | Safe R | Safe R | Safe R | Cornyn (61.6%) |
| Virginia | EVEN | Mark Warner | 65.0% | Likely D | Safe D | Safe D | Safe D | Lean D | Likely D | Likely D | Likely D | Warner (49.1%) |
| West Virginia | R+13 | Jay Rockefeller (retiring) | 63.7% | Likely R (flip) | Safe R (flip) | Safe R (flip) | Safe R (flip) | Likely R (flip) | Safe R (flip) | Safe R (flip) | Safe R (flip) | Capito (62.1%) (flip) |
| Wyoming | R+22 | Mike Enzi | 75.6% | Safe R | Safe R | Safe R | Safe R | Safe R | Safe R | Safe R | Safe R | Enzi (72.2%) |
Alabama[edit]
| |||||||||||||||||
 County results Sessions: 80–90% 90–100% | |||||||||||||||||
| |||||||||||||||||
Three-term incumbent Republican Jeff Sessions had been re-elected with 63% of the vote in 2008. Sessions sought re-election. Democrat Victor Sanchez Williams ran against Sessions as a write-in candidate.[50] Sessions won with 97.3 percent of the vote[51] against assorted write-in candidates.[52]
| Party | Candidate | Votes | % | |
|---|---|---|---|---|
| Republican | Jeff Sessions (Incumbent) | 795,606 | 97.25% | |
| Write-In | Write-in | 22,484 | 2.75% | |
| Total votes | 818,090 | 100.00% | ||
| Republican hold | ||||
Alaska[edit]
| |||||||||||||||||
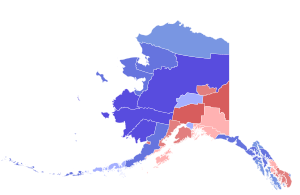 Sullivan: 40–50% 50–60% 60–70% Begich: 40–50% 50–60% 60–70% 70–80% | |||||||||||||||||
| |||||||||||||||||
One-term incumbent Democrat Mark Begich had been first elected with 48% of the vote in 2008, defeating six-term senator Ted Stevens by 3,953 votes (a margin of 1.25%).[54] Begich was 52 years old in 2014 and was seeking re-election to a second term.[55] Stevens, who would have been almost 91 years old at the time of the election, had already filed for a rematch back in 2009,[55] but was killed in a plane crash the following year.
Republican lieutenant governor Mead Treadwell,[56] 2010 nominee Joe Miller,[57] State Natural Resources Commissioner Daniel S. Sullivan,[58] and Air Force veteran John Jaramillo ran for the GOP nomination. In the August 19 primary, Sullivan won the Republican nomination with 40% and defeated Begich in the general election.[59]
Arkansas[edit]
| |||||||||||||||||
 County results Cotton: 40–50% 50–60% 60–70% 70–80% Pryor: 50–60% 60–70% | |||||||||||||||||
| |||||||||||||||||
Two-term incumbent Democrat Mark Pryor had been re-elected with 80% of the vote without Republican opposition in 2008.[60] Pryor was running for a third term.[61]
Freshman Representative Tom Cotton of Arkansas's 4th congressional district was the Republican nominee.[62] In the general election, Cotton defeated Pryor.
| Party | Candidate | Votes | % | |
|---|---|---|---|---|
| Republican | Tom Cotton | 478,819 | 56.50% | |
| Democratic | Mark Pryor (Incumbent) | 334,174 | 39.43% | |
| Libertarian | Nathan LaFrance | 17,210 | 2.03% | |
| Green | Mark Swaney | 16,797 | 1.98% | |
| Write-ins | Others | 505 | 0.06% | |
| Majority | 144,645 | 17.07% | ||
| Total votes | 847,505 | 100.00% | ||
| Republican gain from Democratic | ||||
Colorado[edit]
| |||||||||||||||||
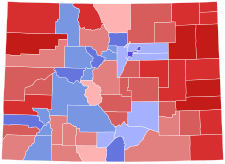 Gardner: 40–50% 50–60% 60–70% 70–80% 80–90% Udall: 40–50% 50–60% 60–70% 70–80% | |||||||||||||||||
| |||||||||||||||||
One-term incumbent Democrat Mark Udall had been elected with 53% of the vote in 2008. Udall was running for re-election.[64]
Congressman Cory Gardner of Colorado's 4th congressional district was the Republican nominee; his late entry into the race caused numerous Republicans to withdraw their candidacies.[65] Gaylon Kent was the Libertarian Party nominee. Unity Party of America founder and National Chairman Bill Hammons was the Unity Party nominee.
| Party | Candidate | Votes | % | |
|---|---|---|---|---|
| Democratic | Mark Udall (incumbent) | 213,746 | 100.00% | |
| Total votes | 213,746 | 100.00% | ||
| Party | Candidate | Votes | % | |
|---|---|---|---|---|
| Republican | Cory Gardner | 338,324 | 100.00% | |
| Total votes | 338,324 | 100.00% | ||
| Party | Candidate | Votes | % | |
|---|---|---|---|---|
| Republican | Cory Gardner | 983,891 | 48.21% | |
| Democratic | Mark Udall (incumbent) | 944,203 | 46.26% | |
| Libertarian | Gaylon Kent | 52,876 | 2.59% | |
| Independent | Steve Shogan | 29,472 | 1.44% | |
| Independent | Raúl Acosta | 24,151 | 1.18% | |
| Unity | Bill Hammons | 6,427 | 0.32% | |
| Total votes | 2,041,020 | 100.00% | ||
| Republican gain from Democratic | ||||
Delaware[edit]
| |||||||||||||||||
 County results Coons: 60–70% | |||||||||||||||||
| |||||||||||||||||
Democrat Chris Coons won in the 2010 United States Senate special election in Delaware caused by Joe Biden's election as Vice President, winning by a 57% to 41% margin. Coons sought re-election. His Republican opponent was engineer Kevin Wade,[68] whom Coons went on to defeat in the general election.
| Party | Candidate | Votes | % | |
|---|---|---|---|---|
| Republican | Kevin Wade | 18,181 | 75.66% | |
| Republican | Carl Smink | 5,848 | 24.34% | |
| Total votes | 24,029 | 100.00% | ||
| Party | Candidate | Votes | % | |
|---|---|---|---|---|
| Democratic | Chris Coons (Incumbent) | 130,655 | 55.83% | |
| Republican | Kevin Wade | 98,823 | 42.23% | |
| Green | Andrew Groff | 4,560 | 1.95% | |
| Total votes | 234,038 | 100.00% | ||
| Democratic hold | ||||
Georgia[edit]
| |||||||||||||||||
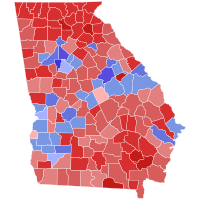 Perdue: 40–50% 50–60% 60–70% 70–80% 80–90% Nunn: 40–50% 50–60% 60–70% 70–80% 80–90% | |||||||||||||||||
| |||||||||||||||||
Two-term incumbent Republican Saxby Chambliss had been re-elected with 57% of the vote in 2008 in a runoff election with former state Representative Jim Martin; Georgia requires run-off elections when no Senate candidate wins over 50% of the vote. Chambliss did not seek a third term.[26]
Political activist Derrick Grayson,[71] Representatives Jack Kingston of Georgia's 1st congressional district,[72] Paul Broun of Georgia's 10th congressional district,[73] and Phil Gingrey of Georgia's 11th congressional district[74] all declared their candidacy for the Republican nomination, as did former secretary of state Karen Handel.[75] In the May 20 primary, no candidate received a majority of votes, so the top two candidates faced each other in a runoff; Perdue narrowly won against Kingston in the runoff primary election on July 22 with 50.9% of the vote.[76]
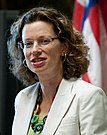
Michelle Nunn, CEO of Points of Light and the daughter of former U.S. Senator Sam Nunn, won the Democratic nomination.[77][78] Other declared Democratic candidates included former state senator Steen Miles, psychiatrist Branko Radulovacki, and former US Army Ranger Todd Robinson. Amanda Swafford, a former Flowery Branch, Georgia, city councilwoman, received the Libertarian Party of Georgia nomination.[79]
| Party | Candidate | Votes | % | |
|---|---|---|---|---|
| Republican | David Perdue | 185,466 | 30.64% | |
| Republican | Jack Kingston | 156,157 | 25.80% | |
| Republican | Karen Handel | 132,944 | 21.96% | |
| Republican | Phil Gingrey | 60,735 | 10.03% | |
| Republican | Paul Broun | 58,297 | 9.63% | |
| Republican | Derrick Grayson | 6,045 | 1.00% | |
| Republican | Art Gardner | 5,711 | 0.94% | |
| Total votes | 605,355 | 100.00% | ||
| Party | Candidate | Votes | % | |
|---|---|---|---|---|
| Republican | David Perdue | 245,951 | 50.88% | |
| Republican | Jack Kingston | 237,448 | 49.12% | |
| Total votes | 483,399 | 100.00% | ||
| Party | Candidate | Votes | % | |
|---|---|---|---|---|
| Democratic | Michelle Nunn | 246,369 | 74.95% | |
| Democratic | Steen Miles | 39,418 | 11.99% | |
| Democratic | Todd Robinson | 31,822 | 9.68% | |
| Democratic | Branko Radulovacki | 11,101 | 3.38% | |
| Total votes | 328,710 | 100.00% | ||
| Party | Candidate | Votes | % | |
|---|---|---|---|---|
| Republican | David Perdue | 1,358,088 | 52.9% | |
| Democratic | Michelle Nunn | 1,160,811 | 45.2% | |
| Libertarian | Amanda Swafford | 48,862 | 1.9% | |
| Total votes | 2,567,761 | 100.0% | ||
| Republican hold | ||||
Hawaii (special)[edit]
| |||||||||||||||||
 County results Schatz: 60–70% 70–80% | |||||||||||||||||
| |||||||||||||||||
Daniel Inouye, the second longest serving United States Senator in U.S. history, died on December 17, 2012, after respiratory complications.[82] Hawaii law allows the Governor of Hawaii, to appoint an interim Senator "who serves until the next regularly-scheduled general election, chosen from a list of three prospective appointees that the prior incumbent's political party submits". Governor Neil Abercrombie did so,[83] selecting Lieutenant Governor Brian Schatz to fill the Senate seat.[84] Inouye had been re-elected in 2010 with 72% of the vote.[85] Schatz was challenged in the Democratic primary by Congresswoman Colleen Hanabusa of Hawaii's 1st congressional district, who Inouye had hoped would be his successor.[86] Schatz defeated Hanabusa in the primary with 48.5% to 47.8%.[87]
Campbell Cavasso, former state representative and nominee for the U.S. Senate in 2004 and 2010, was the Republican nominee.[88]
| Party | Candidate | Votes | % | |
|---|---|---|---|---|
| Democratic | Brian Schatz (incumbent) | 115,445 | 48.5% | |
| Democratic | Colleen Hanabusa | 113,663 | 47.7% | |
| Democratic | Brian Evans | 4,842 | 2.0% | |
| Democratic | Blank vote | 3,842 | 1.6% | |
| Democratic | Over vote | 150 | 0.2% | |
| Total votes | 237,942 | 100.0% | ||
| Party | Candidate | Votes | % | |
|---|---|---|---|---|
| Republican | Campbell Cavasso | 25,874 | 59.00% | |
| Republican | John P. Roco | 4,425 | 10.00% | |
| Republican | Harry J. Friel, Jr. | 3,477 | 8.00% | |
| Republican | Eddie Pirkowski | 2,033 | 5.00% | |
| Republican | Blank vote | 8,306 | 18.00% | |
| Republican | Over vote | 34 | 0.08% | |
| Total votes | 44,149 | 100.00% | ||
| Party | Candidate | Votes | % | |
|---|---|---|---|---|
| Libertarian | Michael Kokoski | 568 | 79.89% | |
| Libertarian | Blank vote | 143 | 20.11% | |
| Total votes | 711 | 100.00% | ||
| Party | Candidate | Votes | % | |
|---|---|---|---|---|
| Independent | Joy Allison | 388 | 34.8% | |
| Independent | Arturo Pacheco Reyes | 184 | 16.5% | |
| Independent | Blank vote | 540 | 48.4% | |
| Independent | Over vote | 3 | 0.3% | |
| Total votes | 1,115 | 100.0% | ||
| Party | Candidate | Votes | % | |
|---|---|---|---|---|
| Democratic | Brian Schatz (incumbent) | 246,827 | 69.8% | |
| Republican | Campbell Cavasso | 98,006 | 27.7% | |
| Libertarian | Michael Kokoski | 8,941 | 2.5% | |
| Total votes | 353,774 | 100.0% | ||
Idaho[edit]
| |||||||||||||||||
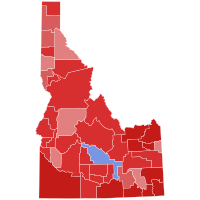 County results Risch: 50–60% 60–70% 70–80% 80–90% Mitchell: 50–60% | |||||||||||||||||
| |||||||||||||||||
One-term incumbent Republican Jim Risch had been elected with 58% of the vote in 2008. Risch sought a second term.[91]
Boise attorney Nels Mitchell was the Democratic nominee.[92]
| Party | Candidate | Votes | % | |
|---|---|---|---|---|
| Republican | Jim Risch (incumbent) | 118,927 | 79.91% | |
| Republican | Jeremy Anderson | 29,897 | 20.09% | |
| Total votes | 148,824 | 100.00% | ||
| Party | Candidate | Votes | % | |
|---|---|---|---|---|
| Democratic | Nels Mitchell | 16,905 | 69.6% | |
| Democratic | William Bryk | 7,383 | 30.4% | |
| Total votes | 24,288 | 100.0% | ||
| Party | Candidate | Votes | % | |
|---|---|---|---|---|
| Republican | Jim Risch (Incumbent) | 285,596 | 65.33% | |
| Democratic | Nels Mitchell | 151,574 | 34.67% | |
| Majority | 134,022 | 30.66% | ||
| Total votes | 437,170 | 100.00% | ||
| Republican hold | ||||
Illinois[edit]
| |||||||||||||||||
 County results Durbin: 40–50% 50–60% 60–70% 70–80% Oberweis: 40–50% 50–60% 60–70% 70–80% | |||||||||||||||||
| |||||||||||||||||
Three-term incumbent and Senate Majority Whip Democrat Dick Durbin had been re-elected with 68% of the vote in 2008. Durbin ran for a fourth term.[95]
State Senator Jim Oberweis was the Republican nominee.[96] He defeated primary challenger Doug Truax with 56% of the vote.
| Party | Candidate | Votes | % | |
|---|---|---|---|---|
| Democratic | Dick Durbin (Incumbent) | 429,031 | 100.00% | |
| Total votes | 429,031 | 100.00% | ||
| Party | Candidate | Votes | % | |
|---|---|---|---|---|
| Republican | Jim Oberweis | 423,097 | 56.08% | |
| Republican | Doug Truax | 331,237 | 43.91% | |
| Republican | Write-in | 54 | <0.01% | |
| Total votes | 754,388 | 100.00% | ||
| Party | Candidate | Votes | % | |
|---|---|---|---|---|
| Democratic | Dick Durbin (Incumbent) | 1,929,637 | 53.55% | |
| Republican | Jim Oberweis | 1,538,522 | 42.69% | |
| Libertarian | Sharon Hansen | 135,316 | 3.76% | |
| Write-In | Various candidates | 44 | 0.00% | |
| Majority | 391,115 | 10.85% | ||
| Total votes | 3,603,519 | 100.00% | ||
| Democratic hold | ||||
Iowa[edit]
| |||||||||||||||||
 Ernst: 40–50% 50–60% 60–70% 70–80% 80–90% Braley: 40–50% 50–60% 60–70% | |||||||||||||||||
| |||||||||||||||||
Five-term incumbent Democrat Tom Harkin had been re-elected with 63% of the vote in 2008. Harkin announced on January 26, 2013, that he would not seek a sixth term.[99] Congressman Bruce Braley was the Democratic nominee.[100][101]
State Senator Joni Ernst was the Republican nominee.[102]
Doug Butzier, who was the Libertarian Party's nominee, died in a plane crash on October 13, 2014, but still appeared on the ballot.[103]
| Party | Candidate | Votes | % | |
|---|---|---|---|---|
| Democratic | Bruce Braley | 62,623 | 99.2% | |
| Democratic | Write-ins | 504 | 0.8% | |
| Total votes | 63,127 | 100.0% | ||
| Party | Candidate | Votes | % | |
|---|---|---|---|---|
| Republican | Joni Ernst | 88,692 | 56.12% | |
| Republican | Sam Clovis | 28,434 | 17.99% | |
| Republican | Mark Jacobs | 26,582 | 16.82% | |
| Republican | Matthew Whitaker | 11,909 | 7.54% | |
| Republican | Scott Schaben | 2,270 | 1.44% | |
| Republican | Write-ins | 144 | 0.09% | |
| Total votes | 158,031 | 100.00% | ||
| Party | Candidate | Votes | % | ±% | |
|---|---|---|---|---|---|
| Republican | Joni Ernst | 588,575 | 52.1% | +14.8% | |
| Democratic | Bruce Braley | 494,370 | 43.8% | -18.9% | |
| Independent | Rick Stewart | 26,815 | 2.4% | +2.4% | |
| Libertarian | Douglas Butzier | 8,232 | 0.7% | +0.7% | |
| Independent | Bob Quast | 5,873 | 0.5% | +0.5% | |
| Independent | Ruth Smith | 4,724 | 0.4% | +0.4% | |
| Other | Write-Ins | 1,111 | 0.1% | +0.02% | |
| Majority | 94,205 | 8.3% | |||
| Turnout | 1,129,700 | ||||
| Republican gain from Democratic | Swing | ||||
Kansas[edit]
| |||||||||||||||||
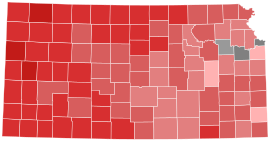 County results Roberts: 40–50% 50–60% 60–70% 70–80% 80–90% Orman: 50–60% 60–70% | |||||||||||||||||
| |||||||||||||||||
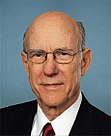
Three-term incumbent Republican Pat Roberts had been re-elected with 60% of the vote in 2008. Roberts sought a fourth term.[106] He faced a primary challenge from radiologist Milton Wolf, a conservative Tea Party supporter.[107] Roberts defeated Wolf in the Republican primary by 48% to 41%.[108] Shawnee County District Attorney Chad Taylor won the Democratic nomination.[109] Randall Batson from Wichita was on the general election ballot as a Libertarian.[110] Also, Greg Orman qualified for the ballot as an independent.[111]
On September 3, Taylor announced he was dropping out of the election, leading to speculation that Democrats would support Orman's candidacy.[112] On September 18, the Kansas Supreme Court ruled that Taylor's name had to be removed from the ballot.[113]
| Party | Candidate | Votes | % | |
|---|---|---|---|---|
| Republican | Pat Roberts (incumbent) | 127,089 | 48.08% | |
| Republican | Milton Wolf | 107,799 | 40.78% | |
| Republican | D.J. Smith | 15,288 | 5.78% | |
| Republican | Alvin E. Zahnter | 13,935 | 5.26% | |
| Total votes | 264,340 | 100.00% | ||
| Party | Candidate | Votes | % | |
|---|---|---|---|---|
| Democratic | Chad Taylor | 35,067 | 53.3% | |
| Democratic | Patrick Wiesner | 30,752 | 46.7% | |
| Total votes | 65,819 | 100.0% | ||
| Party | Candidate | Votes | % | |
|---|---|---|---|---|
| Republican | Pat Roberts (incumbent) | 460,350 | 53.15% | |
| Independent | Greg Orman | 368,372 | 42.53% | |
| Libertarian | Randall Batson | 37,469 | 4.32% | |
| Total votes | 866,191 | 100.00% | ||
Kentucky[edit]
| Turnout | 46.27% | ||||||||||||||||
|---|---|---|---|---|---|---|---|---|---|---|---|---|---|---|---|---|---|
| |||||||||||||||||
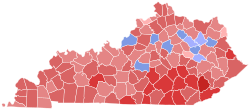 McConnell: 40–50% 50–60% 60–70% 70–80% 80–90% Grimes: 40–50% 50–60% | |||||||||||||||||
| |||||||||||||||||
Five-term Republican incumbent and Senate Minority Leader Mitch McConnell had been re-elected with 53% of the vote in 2008. McConnell sought re-election to a sixth term.[116] McConnell defeated businessman Matt Bevin in the Republican primary on May 20.[117]
Kentucky Secretary of State Alison Lundergan Grimes, with support from much of Kentucky's Democratic leadership, won the Democratic primary.[117][118] Actress Ashley Judd publicly claimed to be considering a run for the Democratic nomination, but ultimately decided against it.[119][120]
Ed Marksberry pursued an independent bid after dropping out of the Democratic field in September 2013.[121][122]
| Party | Candidate | Votes | % | |
|---|---|---|---|---|
| Republican | Mitch McConnell (incumbent) | 213,753 | 60.19% | |
| Republican | Matt Bevin | 125,787 | 35.42% | |
| Republican | Shawna Sterling | 7,214 | 2.03% | |
| Republican | Chris Payne | 5,338 | 1.51% | |
| Republican | Brad Copas | 3,024 | 0.85% | |
| Total votes | 355,116 | 100.00% | ||
| Party | Candidate | Votes | % | |
|---|---|---|---|---|
| Democratic | Alison Lundergan Grimes | 307,821 | 76.47% | |
| Democratic | Greg Leichty | 32,602 | 8.10% | |
| Democratic | Burrel Farnsley | 32,310 | 8.03% | |
| Democratic | Tom Recktenwald | 29,791 | 7.40% | |
| Total votes | 402,524 | 100.00% | ||
Louisiana[edit]
| |||||||||||||||||
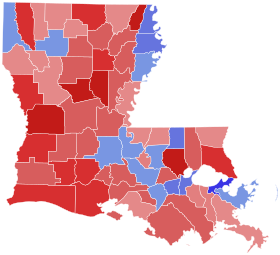
Cassidy: 30–40% 40–50% 50–60% 60–70% 70–80% 80–90% Landrieu: 40–50% 50–60% 60–70% 80–90% | |||||||||||||||||
| |||||||||||||||||
Three-term incumbent Democrat Mary Landrieu had been re-elected with 52% of the vote in 2008. Landrieu ran for a fourth term.[124][125]
Louisiana uses a unique jungle primary system that eschews primaries in favor of run-off elections between the top two candidates; this run-off can be avoided if the winning candidate receives over 50% of the vote. Democrats Wayne Ables, Vallian Senegal, and William Waymire ran against Landrieu in the election, as did Republicans Bill Cassidy (representative of Louisiana's 6th congressional district), Thomas Clements (small business owner), and retired Air Force Colonel Rob Maness.[126][127] Electrical Engineer Brannon McMorris ran as a Libertarian.[128]
Because Republican candidate Maness took almost 14% of the votes in the primary, there was a runoff election on December 6, 2014, between Landrieu (42%) and Cassidy (41%). Cassidy won the runoff with 56% of the vote.
| Party | Candidate | Votes | % | |
|---|---|---|---|---|
| Democratic | Mary Landrieu (Incumbent) | 619,402 | 42.08% | |
| Republican | Bill Cassidy | 603,048 | 40.97% | |
| Republican | Rob Maness | 202,556 | 13.76% | |
| Republican | Thomas Clements | 14,173 | 0.96% | |
| Libertarian | Brannon McMorris | 13,034 | 0.89% | |
| Democratic | Wayne Ables | 11,323 | 0.77% | |
| Democratic | William Waymire | 4,673 | 0.32% | |
| Democratic | Vallian Senegal | 3,835 | 0.26% | |
| Total votes | 1,473,826 | 100.00% | ||
| Party | Candidate | Votes | % | |
|---|---|---|---|---|
| Republican | Bill Cassidy | 712,379 | 55.93% | |
| Democratic | Mary Landrieu (Incumbent) | 561,210 | 44.07% | |
| Total votes | 1,273,589 | 100.00% | ||
| Republican gain from Democratic | ||||
Maine[edit]
| |||||||||||||||||
Collins: 50–60% 60–70% 70–80% 80–90% >90% Bellows: 50–60% 60–70% >90% | |||||||||||||||||
| |||||||||||||||||
Three-term incumbent Republican Susan Collins was seeking a fourth term.[131][132] Shenna Bellows, former executive director of the American Civil Liberties Union of Maine, was the Democratic nominee.[133]
| Party | Candidate | Votes | % | |
|---|---|---|---|---|
| Republican | Susan Collins (Incumbent) | 59,767 | 100.00% | |
| Total votes | 59,767 | 100.00% | ||
| Party | Candidate | Votes | % | |
|---|---|---|---|---|
| Democratic | Shenna Bellows | 65,085 | 100.00% | |
| Total votes | 65,085 | 100.00% | ||
| Party | Candidate | Votes | % | |
|---|---|---|---|---|
| Republican | Susan Collins (Incumbent) | 413,495 | 68.46% | |
| Democratic | Shenna Bellows | 190,244 | 31.50% | |
| Others | 269 | 0.04% | ||
| Total votes | 604,008 | 100.00% | ||
| Republican hold | ||||
Massachusetts[edit]
| |||||||||||||||||
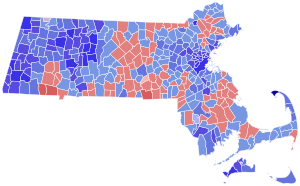
Markey:: 50–60% 60–70% 70–80% 80–90% >90% Herr: 50–60% 60–70% Tie: 40–50% | |||||||||||||||||
| |||||||||||||||||
Five-term incumbent and 2004 Democratic presidential nominee John Kerry had been re-elected with 66% of the vote in 2008. Kerry resigned in early 2013 to become U.S. Secretary of State.[136] Governor Deval Patrick appointed Democrat Mo Cowan to the seat.[137] Democratic Congressman Ed Markey beat Republican Gabriel E. Gomez in the June 25, 2013 special election by a 55% to 45% margin.[138] Markey had served the remainder of Kerry's term before running for re-election to a first full term in 2014. Hopkinton Town Selectman Brian Herr was the Republican nominee.[139]
| Party | Candidate | Votes | % | |
|---|---|---|---|---|
| Democratic | Ed Markey (Incumbent) | 1,285,736 | 61.96% | |
| Republican | Brian Herr | 789,378 | 38.04% | |
| Total votes | 2,075,114 | 100.00% | ||
| Democratic hold | ||||
Michigan[edit]
| |||||||||||||||||
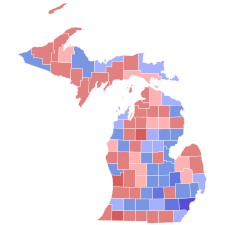 Peters: 40–50% 50–60% 60–70% 70–80% Land: 40–50% 50–60% 60–70% | |||||||||||||||||
| |||||||||||||||||
Six-term incumbent senator and Chairman of the Armed Services Committee Democrat Carl Levin, the longest-serving senator in Michigan's history, had been re-elected with 63% of the vote in 2008. Levin announced on March 7, 2013, that he would not seek re-election.
Three-term Democratic representative Gary Peters of MI-14 was the Democratic nominee.[141] He defeated Republican former secretary of state Terri Lynn Land who was unopposed for the Republican nomination.[142]
| Party | Candidate | Votes | % | |
|---|---|---|---|---|
| Democratic | Gary Peters | 504,102 | 100.00% | |
| Total votes | 504,102 | 100.00% | ||
| Party | Candidate | Votes | % | |
|---|---|---|---|---|
| Republican | Terri Lynn Land | 588,084 | 100.00% | |
| Total votes | 588,084 | 100.00% | ||
| Party | Candidate | Votes | % | ±% | |
|---|---|---|---|---|---|
| Democratic | Gary Peters | 1,704,936 | 54.6% | -8.1% | |
| Republican | Terri Lynn Land | 1,290,199 | 41.3% | +7.5% | |
| Libertarian | Jim Fulner | 62,897 | 2.0% | +.4% | |
| Green | Chris Wahmhoff | 26,137 | 0.9% | 0 | |
| U.S. Taxpayers | Richard Matkin | 37,529 | 1.2% | +.6% | |
| Write-Ins | 77 | 0.0% | 0.0% | ||
| Majority | 414,737 | ||||
| Turnout | 3,121,775 | ||||
| Democratic hold | Swing | ||||
Minnesota[edit]
| |||||||||||||||||
 Franken: 40-50% 50-60% 60-70% McFadden: 40-50% 50-60% | |||||||||||||||||
| |||||||||||||||||
One-term incumbent Democrat Al Franken unseated one-term Republican Norm Coleman by 312 votes in a contested three-way race with 42% of the vote in 2008; the third candidate in the race, former senator Dean Barkley of the Independence Party of Minnesota, won 15% of the vote.[145] Franken sought re-election.[146] State Representative Jim Abeler,[147] St. Louis County Commissioner Chris Dahlberg,[148] co-CEO of Lazard Middle Market Mike McFadden, bison farmer and former hair salon owner Monti Moreno,[149] state Senator Julianne Ortman,[150] and U.S. Navy reservist Phillip Parrish[151] ran for the Republican nomination. McFadden won the Republican primary and was the Republican nominee in the general election.[152]
Hannah Nicollet of the Independence Party of Minnesota also ran.[153]
| Party | Candidate | Votes | % | |
|---|---|---|---|---|
| Democratic (DFL) | Al Franken (Incumbent) | 182,720 | 94.5% | |
| Democratic (DFL) | Sandra Henningsgard | 10,627 | 5.5% | |
| Total votes | 193,347 | 100.0% | ||
| Party | Candidate | Votes | % | |
|---|---|---|---|---|
| Republican | Mike McFadden (endorsed) | 129,601 | 71.74% | |
| Republican | Jim Abeler | 26,714 | 14.79% | |
| Republican | David Carlson | 16,449 | 9.10% | |
| Republican | Patrick Munro | 5,058 | 2.80% | |
| Republican | Ole Savior | 2,840 | 1.57% | |
| Total votes | 180,662 | 100.00% | ||
| Party | Candidate | Votes | % | |
|---|---|---|---|---|
| Independence | Steve Carlson | 2,148 | 33.91% | |
| Independence | Kevin Terrell (endorsed) | 1,376 | 21.72% | |
| Independence | Jack Shepard | 1,130 | 17.83% | |
| Independence | Stephen Williams | 862 | 13.60% | |
| Independence | Tom Books | 820 | 12.94% | |
| Total votes | 6,336 | 100.00% | ||
| Party | Candidate | Votes | % | ±% | |
|---|---|---|---|---|---|
| Democratic (DFL) | Al Franken (Incumbent) | 1,053,205 | 53.15% | +11.16% | |
| Republican | Mike McFadden | 850,227 | 42.91% | +0.93% | |
| Independence | Steve Carlson | 47,530 | 2.40% | -12.75% | |
| Libertarian | Heather Johnson | 29,685 | 1.50% | +1.02% | |
| Write-ins | Others | 881 | 0.04% | ||
| Majority | 202,978 | 10.24% | |||
| Total votes | 1,981,528 | ||||
| Democratic (DFL) hold | Swing | ||||
Mississippi[edit]
| |||||||||||||||||
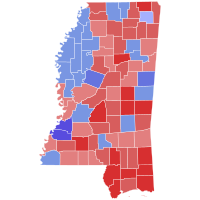 County results Cochran: 50–60% 60–70% 70–80% Childers: 40-50% 50–60% 60–70% 70–80% | |||||||||||||||||
| |||||||||||||||||
Six-term incumbent Republican Thad Cochran, re-elected with 62% of the vote in 2008, ran for re-election.[30] Cochran was the last incumbent senator to declare his plans, leading to widespread speculation that he might announce his retirement.[156][157] Tea Party candidate Chris McDaniel, a conservative Mississippi state senator, ran against Cochran in the Republican primary.[158] Neither McDaniel nor Cochran was able to get 50% of the vote in the first round of the primary, so a runoff election was held June 24.[159] Cochran won the runoff election by 51% to 49%, with the help of Democratic voters eligible to vote in the state's open primaries who chose Cochran as their preferred Republican.[160] McDaniel filed a lawsuit to challenge the results of the run-off, but the challenge was rejected on appeal by the Supreme Court of Mississippi.[161]
Former Congressman Travis Childers was the Democratic nominee.[162]
| Party | Candidate | Votes | % | |
|---|---|---|---|---|
| Republican | Chris McDaniel | 157,733 | 49.5% | |
| Republican | Thad Cochran (incumbent) | 156,315 | 49.0% | |
| Republican | Thomas Carey | 4,854 | 1.5% | |
| Total votes | 318,902 | 100.0% | ||
| Party | Candidate | Votes | % | ±% | |
|---|---|---|---|---|---|
| Republican | Thad Cochran (incumbent) | 194,932 | 51.00% | +2.00% | |
| Republican | Chris McDaniel | 187,265 | 49.00% | −0.50% | |
| Total votes | 382,197 | 100.00% | 0.00% | ||
| Party | Candidate | Votes | % | |
|---|---|---|---|---|
| Democratic | Travis Childers | 63,548 | 73.9% | |
| Democratic | Bill Marcy | 10,361 | 12.1% | |
| Democratic | William Compton | 8,465 | 9.9% | |
| Democratic | Jonathan Rawl | 3,492 | 4.1% | |
| Total votes | 85,866 | 100.0% | ||

| Party | Candidate | Votes | % | ±% | |
|---|---|---|---|---|---|
| Republican | Thad Cochran (Incumbent) | 378,481 | 59.90% | −1.54% | |
| Democratic | Travis Childers | 239,439 | 37.89% | −0.67% | |
| Reform | Shawn O'Hara | 13,938 | 2.21% | +2.21% | |
| Total votes | 631,858 | 100.00% | |||
| Republican hold | Swing | −0.87% | |||
Montana[edit]
| |||||||||||||||||
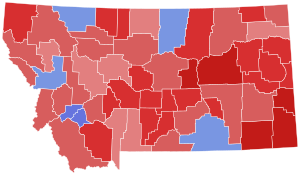 County results Daines: 50–60% 60–70% 70–80% 80–90% Curtis: 50–60% 60–70% | |||||||||||||||||
| |||||||||||||||||
Six-term incumbent Democrat Max Baucus, the longest-serving senator in Montana's history, had been re-elected with 73% of the vote in 2008. Baucus announced on April 23, 2013, that he would retire in 2014, rather than seek re-election to a seventh term.[167] Baucus was appointed as the United States Ambassador to China, leading him to resign from the Senate in February 2014.[168]
Following Baucus's confirmation as ambassador, Governor Steve Bullock appointed the Lieutenant Governor John Walsh to fill the vacant senate seat.[169] Former lieutenant governor John Bohlinger was defeated by Walsh in the Democratic primary. Amid controversy over alleged plagiarism in a 2007 research paper, Walsh pulled out of the race.[170] The Montana Democratic Party held a special nominating convention on August 16 to choose a replacement for Walsh. First-term state representative Amanda Curtis won the nomination, thereby becoming the new Democratic nominee.[171]
Congressman Steve Daines won the Republican nomination[172] over state Representative Champ Edmunds of Missoula and David Leaser of Kalispell.
| Party | Candidate | Votes | % | |
|---|---|---|---|---|
| Democratic | John Walsh (incumbent) | 48,665 | 64.04% | |
| Democratic | John Bohlinger | 17,187 | 22.62% | |
| Democratic | Dirk Adams | 10,139 | 13.34% | |
| Total votes | 75,991 | 100.00% | ||
| Party | Candidate | Votes | % | |
|---|---|---|---|---|
| Democratic | Amanda Curtis | 82 | 64.0% | |
| Democratic | Dirk Adams | 46 | 36.0% | |
| Total votes | 128 | 100.0% | ||
| Party | Candidate | Votes | % | |
|---|---|---|---|---|
| Republican | Steve Daines | 110,565 | 83.37% | |
| Republican | Susan Cundiff | 11,909 | 8.98% | |
| Republican | Champ Edmunds | 10,151 | 7.65% | |
| Total votes | 132,625 | 100.00% | ||
| Party | Candidate | Votes | % | ±% | |
|---|---|---|---|---|---|
| Republican | Steve Daines | 213,709 | 57.79% | +30.71% | |
| Democratic | Amanda Curtis | 148,184 | 40.07% | -32.85% | |
| Libertarian | Roger Roots | 7,933 | 2.14% | n/a | |
| Majority | 65,525 | 17.72% | +63.56% | ||
| Turnout | 369,826 | 100.00% | |||
| Republican gain from Democratic | Swing | ||||
Nebraska[edit]
| | |||


 French
 Deutsch


