2022 United States House of Representatives elections in Florida
| |||||||||||||||||||||||||
All 28 Florida seats to the United States House of Representatives | |||||||||||||||||||||||||
|---|---|---|---|---|---|---|---|---|---|---|---|---|---|---|---|---|---|---|---|---|---|---|---|---|---|
| |||||||||||||||||||||||||
| |||||||||||||||||||||||||
| Elections in Florida |
|---|
 |
| |
The 2022 United States House of Representatives elections in Florida were held on November 8, 2022, to elect the 28 U.S. representatives from Florida, one from each of the state's 28 congressional districts. The primary was held on August 23, 2022.[1] The elections coincided with the 2022 United States Senate election in Florida, other elections to the House of Representatives, other elections to the United States Senate, and various state and local elections.
The Republican Party gained four seats, increasing their majority from 16–11 to 20–8. No Republican lost re-election.
Results summary[edit]
Statewide[edit]
| Party | Candi- dates | Votes | Seats | ||||
|---|---|---|---|---|---|---|---|
| No. | % | No. | +/– | % | |||
| Republican Party | 28 | 4,271,196 | 58.25% | 20 | 71.43% | ||
| Democratic Party | 25 | 2,905,702 | 39.63% | 8 | 28.57% | ||
| Libertarian Party | 2 | 80,370 | 1.10% | 0 | 0% | ||
| Independent | 8 | 75,036 | 1.02% | 0 | 0% | ||
| Total | 61 | 7,332,304 | 100% | 28 | 100% | ||
District[edit]
Results of the 2022 United States House of Representatives elections in Florida by district:[2]
| District | Republican | Democratic | Others | Total | Result | ||||
|---|---|---|---|---|---|---|---|---|---|
| Votes | % | Votes | % | Votes | % | Votes | % | ||
| District 1 | 197,349 | 67.86% | 93,467 | 32.14% | 0 | 0% | 290,816 | 100.00% | Republican hold |
| District 2 | 180,236 | 59.8% | 121,153 | 40.2% | 0 | 0% | 301,389 | 100.00% | Republican hold |
| District 3 | 178,101 | 62.52% | 103,382 | 36.29% | 3,410 | 1.2% | 284,893 | 100.00% | Republican hold |
| District 4 | 165,696 | 60.45% | 108,402 | 39.45% | 5 | <0.01% | 274,103 | 100.00% | Republican gain |
| District 5 | 0 | - | 0 | - | 0 | - | 0 | 100.00% | Republican hold |
| District 6 | 226,548 | 75.33% | 0 | 0% | 74,207 | 24.67% | 300,755 | 100.00% | Republican hold |
| District 7 | 177,966 | 58.53% | 126,079 | 41.47% | 10 | <0.01% | 304,055 | 100.00% | Republican gain |
| District 8 | 222,128 | 64.91% | 120,080 | 35.09% | 0 | 0% | 342,208 | 100.00% | Republican hold |
| District 9 | 93,827 | 46.36% | 108,541 | 53.64% | 0 | 0% | 202,368 | 100.00% | Democratic hold |
| District 10 | 78,844 | 38.44% | 117,955 | 59.00% | 3,111 | 1.56% | 199,910 | 100.00% | Democratic hold |
| District 11 | 205,995 | 63.07% | 115,647 | 35.41% | 4,967 | 1.52% | 326,609 | 100.00% | Republican hold |
| District 12 | 226,583 | 70.38% | 95,377 | 29.62% | 4 | <0.01% | 321,964 | 100.00% | Republican hold |
| District 13 | 181,487 | 53.14% | 153,876 | 45.05% | 6,183 | 1.81% | 341,546 | 100.00% | Republican gain |
| District 14 | 113,427 | 43.1% | 149,737 | 56.9% | 0 | 0% | 263,164 | 100.00% | Democratic hold |
| District 15 | 145,219 | 58.54% | 102,835 | 41.46% | 0 | 0% | 248,054 | 100.00% | Republican gain |
| District 16 | 189,762 | 62.14% | 115,575 | 37.85% | 21 | 0.01% | 305,358 | 100.0% | Republican hold |
| District 17 | 222,601 | 63.85% | 123,822 | 35.51% | 2,226 | 0.64% | 348,649 | 100.00% | Republican hold |
| District 18 | 167,429 | 74.67% | 0 | 0% | 56,805 | 25.33% | 224,234 | 100.00% | Republican hold |
| District 19 | 213,035 | 68.00% | 100,226 | 31.99% | 13 | 0% | 313,274 | 100.00% | Republican hold |
| District 20 | 52,151 | 27.69% | 136,215 | 72.31% | 0 | 0% | 188,366 | 100.00% | Democratic hold |
| District 21 | 208,614 | 63.5% | 119,891 | 36.5% | 0 | 0% | 328,505 | 100.00% | Republican hold |
| District 22 | 122,194 | 44.89% | 150,010 | 55.11% | 0 | 0% | 272,204 | 100.00% | Democratic hold |
| District 23 | 130,681 | 46.83% | 143,951 | 51.59% | 4,417 | 1.58% | 279,049 | 100.00% | Democratic hold |
| District 24 | 52,449 | 28.21% | 133,442 | 71.79% | 0 | 0% | 185,891 | 100.00% | Democratic hold |
| District 25 | 105,239 | 44.91% | 129,113 | 55.09% | 0 | % | 234,352 | 100.00% | Democratic hold |
| District 26 | 143,240 | 70.87% | 58,868 | 29.13% | 0 | 0% | 202,108 | 100.00% | Republican hold |
| District 27 | 136,038 | 57.29% | 101,404 | 42.71% | 0 | 0% | 237,442 | 100.00% | Republican hold |
| District 28 | 134,457 | 63.68% | 76,665 | 36.31% | 28 | 0.01% | 211,150 | 100.00% | Republican hold |
| Total | 4,271,296 | 58.25% | 2,905,713 | 39.63% | 145,406 | 2.12% | 7,332,415 | 100.00% | |
District 1[edit]
| |||||||||||||||||
| |||||||||||||||||
County & precinct results Gaetz: 50–60% 60–70% 70–80% 80–90% >90% Jones: 50–60% 60–70% 70–80% 80–90% >90% | |||||||||||||||||
| |||||||||||||||||
Republican Matt Gaetz, who had represented the district since 2017, was re-elected with 64.6% of the vote in 2020.[3] He won re-election in 2022.[4]
The 1st district contains all of Escambia, Okaloosa and Santa Rosa counties, as well as the western portion of Walton county. Following redistricting the district shrank somewhat, losing its portion of Holmes County and part of Walton County.
Despite losing by an overwhelming margin, Jones ended up being the biggest overperformer in this election cycle for a Florida congressional candidate when compared to the top of the ticket. Jones outperformed Val Demings, the Democratic nominee for the concurrent U.S. Senate race, by approximately 9 percentage points, and Charlie Crist, the Democratic nominee for Florida governor, by about 11 percentage points within this district's borders. However, this likely had everything to do with the numerous scandals that faced Matt Gaetz.
Republican primary[edit]
Candidates[edit]
Nominee[edit]
- Matt Gaetz, incumbent U.S. representative[5]
Eliminated in primary[edit]
- Mark Lombardo, Marine combat veteran, former FedEx executive and pilot[6]
- Greg Merk, former U.S. Air Force officer and candidate for this district in 2020[7]
Withdrawn[edit]
- Bryan Jones, pilot[8]
- Angela Marie Walls-Windhauser, perennial candidate
Did not qualify[edit]
- Jeremy Kelly, U.S. Marine Corps veteran[7]
- John Mills, former U.S. Navy officer and candidate for this district in 2016, 2018, and 2020[9]
Declined[edit]
- Alex Andrade, state representative[10] (running for re-election)[11]
- Doug Bates, attorney[10]
- Doug Broxson, state senator[12] (running for re-election)[13]
- Chris Dosev, businessman and candidate for this district in 2016 and 2018[12]
- George Gainer, state senator[12] (running for re-election)[14]
- Ashton Hayward, former mayor of Pensacola[10]
- Mike Hill, former state representative[12]
- Larry Keefe, former U.S. attorney for the Northern District of Florida[10]
- Carolyn Ketchel, Okaloosa County commissioner[12]
- Laura Loomer, reporter for InfoWars, far-right activist, and nominee for Florida's 21st congressional district in 2020[12] (running in the 11th district)[15]
- Anna Paulina Luna, director of Hispanic Engagement for Turning Point USA and nominee for Florida's 13th congressional district in 2020[10] (running in the 13th district)[16]
- Jimmy Patronis, Chief Financial Officer of Florida[10] (running for re-election)[17]
- Grover C. Robinson IV, mayor of Pensacola[10]
- Anthony Sabatini, state representative[10] (running in the 7th district)[18]
- Frank White, former state representative and candidate for Florida attorney general in 2018[10]
- Jayer Williamson, state representative[12] (running for re-election)[19]
Endorsements[edit]
- Executive Branch officials
- Donald Trump, 45th president of the United States (2017–2021)[20]
Results[edit]

- Gaetz—70-80%
- Gaetz—60–70%
| Party | Candidate | Votes | % | |
|---|---|---|---|---|
| Republican | Matt Gaetz (incumbent) | 73,374 | 69.7 | |
| Republican | Mark Lombardo | 25,720 | 24.4 | |
| Republican | Greg Merk | 6,170 | 5.9 | |
| Total votes | 105,264 | 100.0 | ||
Democratic primary[edit]
Candidates[edit]
Nominee[edit]
- Rebekah Jones, former Florida Department of Health analyst (disqualified, granted stay order by Appellate Court, then reinstated to ballot)[22][23][24][25][26]
Eliminated in primary[edit]
- Peggy Schiller, attorney[24]
Declined[edit]
- Dianne Krumel, Florida Democratic Party committeewoman[10]
- Lumon May, Escambia County commissioner[10]
- Jennifer Zimmerman, pediatrician and nominee for this district in 2018[10]
Results[edit]

- Jones—60–70%
| Party | Candidate | Votes | % | |
|---|---|---|---|---|
| Democratic | Rebekah Jones | 21,875 | 62.6 | |
| Democratic | Peggy Schiller | 13,091 | 37.4 | |
| Total votes | 34,966 | 100.0 | ||
General election[edit]
Debate[edit]
| No. | Date | Host | Moderator | Link | Republican | Democratic |
|---|---|---|---|---|---|---|
| Key: P Participant A Absent N Not invited I Invited W Withdrawn | ||||||
| Matt Gaetz | Rebekah Jones | |||||
| 1 | Oct. 26, 2022 | WSRE | Mollye Barrows Sandra Averhart | PBS | P | P |
Predictions[edit]
| Source | Ranking | As of |
|---|---|---|
| The Cook Political Report[27] | Solid R | April 25, 2022 |
| Inside Elections[28] | Solid R | May 17, 2022 |
| Sabato's Crystal Ball[29] | Safe R | April 27, 2022 |
| Politico[30] | Solid R | April 28, 2022 |
| RCP[31] | Safe R | June 9, 2022 |
| Fox News[32] | Solid R | July 11, 2022 |
| DDHQ[33] | Solid R | July 20, 2022 |
| 538[34] | Solid R | June 30, 2022 |
| The Economist[35] | Safe R | September 28, 2022 |
Polling[edit]
| Poll source | Date(s) administered | Sample size | Margin of error | Matt Gaetz (R) | Rebekah Jones (D) | Undecided |
|---|---|---|---|---|---|---|
| The Listener Group/The Political Matrix (R) | September 22–26, 2022 | 618 (LV) | ± 4.8% | 41% | 39% | 21% |
| The Listener Group/The Political Matrix (R) | February 25 – March 8, 2022 | 432 (LV) | ± 4.3% | 47% | 53% | – |
| The Listener Group/The Political Matrix (R) | October 8–28, 2021 | 532 (LV) | ± 4.3% | 42% | 34% | 24% |
Results[edit]
| Party | Candidate | Votes | % | ||
|---|---|---|---|---|---|
| Republican | Matt Gaetz (incumbent) | 197,349 | 67.9 | ||
| Democratic | Rebekah Jones | 93,467 | 32.1 | ||
| Total votes | 290,816 | 100.0 | |||
| Republican hold | |||||
District 2[edit]
| |||||||||||||||||
| |||||||||||||||||
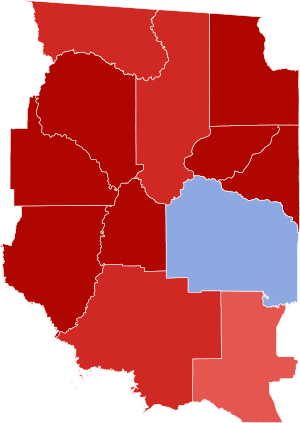
County results Dunn: 50–60% 60–70% 70–80% 80–90% >90% Lawson: 50–60% 60–70% 70–80% 80–90% >90% | |||||||||||||||||
| |||||||||||||||||
Republican Neal Dunn, who had represented the district since 2017, was re-elected with 97% of the vote in 2020. Dunn won re-election in 2022.[3]
The boundaries of the district were redrawn from 2020, determined by the 2020 redistricting cycle.
Republican primary[edit]
Candidates[edit]
Nominee[edit]
- Neal Dunn, incumbent U.S. representative[37]
Democratic primary[edit]
Candidates[edit]
Nominee[edit]
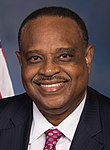
- Al Lawson, incumbent U.S. representative[38]
Withdrawn[edit]
- Karen Stripling, Southern Poverty Law Center activist[39]
Endorsements[edit]
- Organizations
- Labor unions
Independent and third-party candidates[edit]
Independents[edit]
General election[edit]
Predictions[edit]
| Source | Ranking | As of |
|---|---|---|
| The Cook Political Report[27] | Solid R | April 25, 2022 |
| Inside Elections[28] | Solid R | May 17, 2022 |
| Sabato's Crystal Ball[29] | Safe R | April 27, 2022 |
| Politico[30] | Likely R | April 28, 2022 |
| RCP[31] | Safe R | June 9, 2022 |
| Fox News[32] | Solid R | July 11, 2022 |
| DDHQ[33] | Solid R | July 20, 2022 |
| 538[34] | Solid R | June 30, 2022 |
| The Economist[35] | Safe R | September 28, 2022 |
Polling[edit]
| Poll source | Date(s) administered | Sample size[a] | Margin of error | Al Lawson (D) | Neal Dunn (R) | Undecided |
|---|---|---|---|---|---|---|
| David Binder Research (D)[b] | September 14–18, 2022 | 600 (LV) | ± 4.0% | 43% | 49% | 8% |
| Sachs Media Group | June 20–23, 2022 | 400 (LV) | ± 4.9% | 40% | 43% | 17% |
Results[edit]
| Party | Candidate | Votes | % | |
|---|---|---|---|---|
| Republican | Neal Dunn (incumbent) | 180,236 | 59.8 | |
| Democratic | Al Lawson (incumbent) | 121,153 | 40.2 | |
| Total votes | 301,389 | 100.0 | ||
| Republican hold | ||||
District 3[edit]
| |||||||||||||||||
| |||||||||||||||||
County and precinct results Cammack: 40-50% 50–60% 60–70% 70–80% 80–90% >90% Hawk: 40–50% 50–60% 60–70% 70-80% 80-90% >90% No votes: | |||||||||||||||||
| |||||||||||||||||
Republican Kat Cammack, who had represented the district since 2021, was elected with 57% of the vote in 2020.[3] Cammack won re-election in 2022.
The boundaries of the district were redrawn from 2020, determined by the 2020 redistricting cycle.
Republican primary[edit]

- Cammack—>90%
- Cammack—80-90%
- Cammack—70-80%
Nominee[edit]
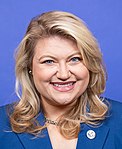
- Kat Cammack, incumbent U.S. representative[45]
Eliminated in primary[edit]
- Justin Waters, lawyer[46]
Withdrawn[edit]
- Manuel Asensio, businessman[47]
Endorsements[edit]
- Executive Branch officials
- Donald Trump, 45th president of the United States (2017–2021)[48]
- Organizations
Results[edit]
| Party | Candidate | Votes | % | |
|---|---|---|---|---|
| Republican | Kat Cammack (incumbent) | 63,279 | 85.2 | |
| Republican | Justin Waters | 11,022 | 14.8 | |
| Total votes | 74,301 | 100.0 | ||
Democratic primary[edit]

- Hawk—70-80%
- Hawk—60-70%
- Hawk—50-60%
- Wells—50-60%
Candidates[edit]
Nominee[edit]
- Danielle Hawk, customer service representative[52]
Eliminated in primary[edit]
Endorsements[edit]
- Organizations
Results[edit]
| Party | Candidate | Votes | % | |
|---|---|---|---|---|
| Democratic | Danielle Hawk | 37,181 | 67.6 | |
| Democratic | Tom Wells | 17,799 | 32.4 | |
| Total votes | 54,980 | 100.0 | ||
Independents[edit]
- Linda Brooks, historian
General election[edit]
Predictions[edit]
| Source | Ranking | As of |
|---|---|---|
| The Cook Political Report[27] | Solid R | April 25, 2022 |
| Inside Elections[28] | Solid R | May 17, 2022 |
| Sabato's Crystal Ball[29] | Safe R | April 27, 2022 |
| Politico[30] | Solid R | April 28, 2022 |
| RCP[31] | Safe R | June 9, 2022 |
| Fox News[32] | Solid R | July 11, 2022 |
| DDHQ[33] | Solid R | July 20, 2022 |
| 538[34] | Solid R | June 30, 2022 |
| The Economist[35] | Safe R | September 28, 2022 |
Results[edit]
| Party | Candidate | Votes | % | |
|---|---|---|---|---|
| Republican | Kat Cammack (incumbent) | 178,101 | 62.5 | |
| Democratic | Danielle Hawk | 103,382 | 36.3 | |
| Independent | Linda Brooks | 3,410 | 1.2 | |
| Total votes | 284,893 | 100.0 | ||
| Republican hold | ||||
District 4[edit]
| |||||||||||||||||
| |||||||||||||||||
County & precinct results Bean: 50–60% 60–70% 70–80% 80–90% >90% Halloway: 50–60% 60–70% 70–80% 80–90% >90% | |||||||||||||||||
| |||||||||||||||||
The boundaries of the district were redrawn from 2020, determined by the 2020 redistricting cycle.
The 4th district (formerly the 5th) was drawn to be much more conservative than on the previous map, losing Tallahassee and some competitive parts of Duval county and gaining the counties of Nassau and Clay. As a result, the east-to-west layout connecting Tallahassee to Jacksonville was removed entirely.
Democratic primary[edit]
Candidates[edit]
Nominee[edit]
- LaShonda Holloway, former congressional aide and candidate for Florida's 5th congressional district in 2016 and 2020[55]
Eliminated in primary[edit]
- Tony Hill, former state senator (2002–2011)[56]
Declined[edit]
- Audrey Gibson, state senator (2011–present) and former Minority Leader of the Florida Senate (2018–2020)[57] (running for mayor of Jacksonville)[58]
Endorsements[edit]
Results[edit]

- Holloway—50-60%
- Hill—50-60%
| Party | Candidate | Votes | % | |
|---|---|---|---|---|
| Democratic | LaShonda Holloway | 29,352 | 50.2 | |
| Democratic | Tony Hill | 29,145 | 49.8 | |
| Total votes | 58,455 | 100.0 | ||
Republican primary[edit]
Candidates[edit]
Declared[edit]
Nominee[edit]
- Aaron Bean, president pro tempore of the Florida Senate[59][60]
Eliminated in primary[edit]
- Erick Aguilar, U.S. Navy (retired), professor and candidate for FL-04 in 2020[61][62]
- Jon Chuba, insurance analyst[63]
Withdrawn[edit]
- Jason Fischer, member of the Florida House of Representatives[64][59][65][66][67] (running for Duval County property appraiser)
Declined[edit]
- Lenny Curry, mayor of Jacksonville[68][69] (endorsed Bean)[70]
- Rory Diamond, member of the Jacksonville City Council[64][71] (endorsed Bean)[70]
Endorsements[edit]
- Cabinet officials
- Ryan Zinke, former United States Secretary of the Interior (2017–2019), U.S. Representative from Montana (2015–2017) and Republican nominee for Montana's 1st congressional district in 2022[72]
- Organizations
- U.S. senators
- Marco Rubio, U.S. senator from Florida (2011–)[75]
- U.S. representatives
- Ander Crenshaw, former U.S. representative for Florida's 4th congressional district (2001–2017)[76]
- State officials
- State legislators
- Jennifer Bradley, state senator[78]
- Rob Bradley, former state senator (2012–2020)[78]
- Travis Cummings, former state representative (2012–2020)[78]
- Wyman Duggan, state representative[79]
- Jay Fant, former state representative (2014–2018)[79]
- Sam Garrison, state representative[78]
- Jim Horne, former state senator (1995–2001), former Florida Commissioner of Education (2003–2004)[78]
- Dick Kravitz, former state representative (2000–2008), former member of the Jacksonville City Council[70]
- Bobby Payne, state representative[78]
- Lake Ray, former state representative (2008–2016)[79]
- Clay Yarborough, state representative[79]
- Sheriffs
- Michelle Cook, Clay County sheriff[80]
- Pat Ivey, Jacksonville sheriff[79]
- Bill Leeper, Nassau County sheriff[80]
- Mike Williams, former Jacksonville sheriff[79]
- Local officials
- Greg Anderson, former member of the Jacksonville City Council[70]
- Ken Bass, Callahan town council president[76]
- Bradley Bean, Fernandina Beach city commissioner (candidate's son)[76]
- John Beasley, Hilliard town councilman[76]
- Aaron Bell, Nassau County commissioner[76]
- Aaron Bowman, member of the Jacksonville City Council[70]
- David Broskie, superintendent of the Clay County School District[78]
- Elaine Brown, mayor of Neptune Beach[76]
- Tony Brown, Keystone Heights city commissioner[78][c]
- Kristine Burke, Clay County commissioner[78]
- Kathy Burns, superintendent of the Nassau County School District[76]
- Matt Carlucci, member of the Jacksonville City Council[70]
- Doyle Carter, former member of the Jacksonville City Council[70]
- Mike Cella, Clay County commissioner[78]
- Lenny Curry, mayor of Jacksonville (2015–)[79]
- Randy DeFoor, member of the Jacksonville City Council[70]
- Rory Diamond, member of the Jacksonville City Council[70]
- Thomas Ford, Nassau County commissioner[76]
- Terrence Freeman, president of the Jacksonville City Council[70]
- Ed Gaw, Green Cove Springs city councilman[78]
- Ellen Glasser, mayor of Atlantic Beach[76]
- Shirley Graham, former mayor of Callahan[76]
- Jim Hauber, Orange Park city councilman[78]
- Gayward Hendry, former Clay County commissioner[78]
- Jimmy Higginbotham, former Nassau County commissioner[76]
- Alberta Hipps, former member of the Jacksonville City Council[70]
- Chris Hoffman, mayor of Jacksonville Beach[76]
- Nick Howland, member of the Jacksonville City Council[70]
- Len Kreger, vice mayor of Fernandina Beach[76]
- Jim Love, former member of the Jacksonville City Council
- Sean Lynch, mayor of Baldwin[76]
- John Martin, Nassau County commissioner[76]
- Sam Newby, member of the Jacksonville City Council[70]
- J.B. Renninger, Clay County commissioner[78]
- John Ruis, former superintendent of the Nassau County School District[76]
- Ron Salem, vice-president of the Jacksonville City Council[70]
- Matt Schellenberg, former member of the Jacksonville City Council[70]
- Thomas Smith, Green Cove Springs city councilman[78]
- Ginger Soud, former member of the Jacksonville City Council[70]
- George Spicer, former Nassau County commissioner[76]
- David Sturges, Fernandina Beach city commissioner[76]
- Justin Taylor, former Nassau County commissioner[76]
- Randy White, member of the Jacksonville City Council[70]
- Scott Wilson, former member of the Jacksonville City Council[70]
- Individuals
- Jennifer Carroll, former lieutenant governor of Florida (2011–2013)[76]
- John Delaney, former mayor of Jacksonville (1995–2003)[76]
- John Peyton, former mayor of Jacksonville (2003–2011)[76]
- John E. Thrasher, former speaker of the Florida House of Representatives (1998–2000)[76]
- Organizations
- Individuals
- Grover Norquist, president of Americans for Tax Reform[82]
Polling[edit]
| Poll source | Date(s) administered | Sample size[a] | Margin of error | Erick Aguilar | Aaron Bean | Jon Chuba | Undecided |
|---|---|---|---|---|---|---|---|
| St. Pete Polls | August 4, 2022 | 312 (LV) | ± 5.5% | 16% | 59% | 6% | 19% |
| The Tyson Group (R)[A] | July 5–7, 2022 | 400 (LV) | ± 4.9% | 14% | 24% | 3% | 59% |
Results[edit]
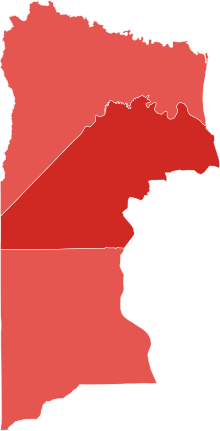
- Bean—70-80%
- Bean—60-70%
| Party | Candidate | Votes | % | |
|---|---|---|---|---|
| Republican | Aaron Bean | 49,060 | 68.1 | |
| Republican | Erick Aguilar | 18,605 | 25.8 | |
| Republican | Jon Chuba | 4,388 | 6.1 | |
| Total votes | 72,053 | 100.0 | ||
Independents[edit]
- Gary Lee Konitz, investigative journalist[83] (write-in candidate)
General election[edit]
Predictions[edit]
| Source | Ranking | As of |
|---|---|---|
| The Cook Political Report[27] | Solid R (flip) | April 25, 2022 |
| Inside Elections[28] | Solid R (flip) | May 17, 2022 |
| Sabato's Crystal Ball[29] | Safe R (flip) | July 28, 2022 |
| Politico[30] | Likely R (flip) | April 28, 2022 |
| RCP[31] | Likely R (flip) | September 29, 2022 |
| Fox News[32] | Solid R (flip) | July 11, 2022 |
| DDHQ[33] | Solid R (flip) | July 20, 2022 |
| 538[34] | Solid R (flip) | June 30, 2022 |
| The Economist[35] | Safe R (flip) | September 28, 2022 |
Polling[edit]
| Poll source | Date(s) administered | Sample size[a] | Margin of error | LaShonda Holloway (D) | Aaron Bean (R) | Undecided |
|---|---|---|---|---|---|---|
| University of North Florida Archived October 31, 2022, at the Wayback Machine | October 20–27, 2022 | 413 (LV) | ± 5.4% | 38% | 50% | 12% |
Results[edit]
| Party | Candidate | Votes | % | |
|---|---|---|---|---|
| Republican | Aaron Bean | 165,696 | 60.5 | |
| Democratic | LaShonda Holloway | 108,402 | 39.5 | |
| Independent | Gary Koniz (write-in) | 5 | 0.0 | |
| Total votes | 274,103 | 100.0 | ||
| Republican gain from Democratic | ||||
District 5[edit]
| |||||||||||
| |||||||||||
| |||||||||||
Republican John Rutherford, who had represented the 5th district since 2017 (or 4th depending on numbering), was re-elected with 61% of the vote in 2020.[3] Rutherford won re-election unopposed in 2022.
The boundaries of the district were redrawn from 2020, determined by the 2020 redistricting cycle.
Republican primary[edit]
Candidates[edit]
Nominee[edit]
- John Rutherford, incumbent U.S. representative[84]
Eliminated in primary[edit]
Results[edit]

- Rutherford—60-70%
| Party | Candidate | Votes | % | |
|---|---|---|---|---|
| Republican | John Rutherford (incumbent) | 87,720 | 65.7 | |
| Republican | Mara Macie | 23,607 | 17.7 | |
| Republican | Luna Lopez | 22,283 | 16.7 | |
| Total votes | 133,610 | 100.0 | ||
Democratic primary[edit]
Candidates[edit]
No Democratic candidates filed to run.
General election[edit]
Predictions[edit]
| Source | Ranking | As of |
|---|---|---|
| The Cook Political Report[27] | Solid R | April 25, 2022 |
| Inside Elections[28] | Solid R | May 17, 2022 |
| Sabato's Crystal Ball[29] | Safe R | April 27, 2022 |
| Politico[30] | Solid R | April 28, 2022 |
| RCP[31] | Safe R | June 9, 2022 |
| Fox News[32] | Solid R | July 11, 2022 |
| DDHQ[33] | Solid R | July 20, 2022 |
| 538[34] | Solid R | June 30, 2022 |
| The Economist[35] | Safe R | September 28, 2022 |
Results[edit]
| Party | Candidate | Votes | % | ||
|---|---|---|---|---|---|
| Republican | John Rutherford (incumbent) | Unopposed | |||
| Total votes | N/A | 100.0 | |||
| Republican hold | |||||
District 6[edit]
| |||||||||||||||||
| |||||||||||||||||
County & precinct results Waltz: 50–60% 60–70% 70–80% 80–90% >90% Hannoush: 50–60% 60–70% 70–80% | |||||||||||||||||
| |||||||||||||||||
Republican Michael Waltz, who had represented the district since 2019, was elected with 60% of the vote in 2020.[3] Waltz won re-election in 2022.
The boundaries of the district were redrawn from 2020, determined by the 2020 redistricting cycle. The 6th district was changed to lose half of Volusia County, while also taking in Putnam County and the eastern portion of Marion County. However, despite experiencing massive changes to his district, and therefore his electorate, Waltz did not face any major primary threats in this election.
Republican primary[edit]

- Waltz—80-90%
- Waltz—70-80%
- Waltz—60–70%
Candidates[edit]
Nominee[edit]
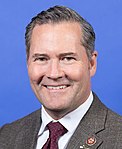
- Michael Waltz, incumbent U.S. representative[87]
Eliminated in primary[edit]
- Charles Davis, mortgage banker[88]
Endorsements[edit]
- Executive Branch officials
- Nikki Haley, former U.S. Ambassador to the United Nations (2017–2018) and former governor of South Carolina (2011–2017)[89]
- Donald Trump, 45th president of the United States (2017–2021)[90]
- Individuals
- Peter Thiel, entrepreneur and venture capitalist[91]
- Organizations
Results[edit]
| Party | Candidate | Votes | % | |
|---|---|---|---|---|
| Republican | Michael Waltz (incumbent) | 65,694 | 77.4 | |
| Republican | Charles Davis | 19,175 | 22.6 | |
| Total votes | 84,869 | 100.0 | ||
Democratic primary[edit]
Candidates[edit]
Did not qualify[edit]
- Matt Bell
- Clint Curtis, lawyer and nominee for California's 4th congressional district in 2010 and for Florida's 6th congressional district in 2020[93]
Withdrawn[edit]
- Richard Thripp, former chair of the Volusia County Democratic Party and candidate for this district in 2020[89][93]
Declined[edit]
Independent and third-party candidates[edit]
Libertarian Party[edit]
Nominee[edit]
- Joe Hannoush, information systems technician[95]
Independents[edit]
Did not qualify[edit]
General election[edit]
Predictions[edit]
| Source | Ranking | As of |
|---|---|---|
| The Cook Political Report[27] | Solid R | April 25, 2022 |
| Inside Elections[28] | Solid R | May 17, 2022 |
| Sabato's Crystal Ball[29] | Safe R | April 27, 2022 |
| Politico[30] | Solid R | April 28, 2022 |
| RCP[31] | Safe R | June 9, 2022 |
| Fox News[32] | Solid R | July 11, 2022 |
| DDHQ[33] | Solid R | July 20, 2022 |
| 538[34] | Solid R | June 30, 2022 |
| The Economist[35] | Safe R | September 28, 2022 |
Results[edit]
| Party | Candidate | Votes | % | |
|---|---|---|---|---|
| Republican | Michael Waltz (incumbent) | 226,548 | 75.3 | |
| Libertarian | Joe Hannoush | 74,207 | 24.7 | |
| Total votes | 300,755 | 100.0 | ||
| Republican hold | ||||
District 7[edit]
| |||||||||||||||||
| |||||||||||||||||
County & precinct results Mills: 50–60% 60–70% 70–80% 80–90% Green: 50–60% 60–70% 70–80% | |||||||||||||||||
| |||||||||||||||||
Democrat Stephanie Murphy, who had represented the district since 2017, was re-elected with 55% of the vote in 2020.[3] Murphy initially stated she would run for re-election, but on December 20, 2021, she announced she would not run.[96]
The boundaries of the district were redrawn from 2020, determined by the 2020 redistricting cycle. The 7th district was drawn to be much more conservative than on the previous map, simply by pairing Seminole County with Volusia instead of Orange.
This district was included on the list of Democratic-held seats the National Republican Congressional Committee was targeting in 2022.[97]
Democratic primary[edit]
Candidates[edit]
Nominee[edit]
- Karen Green, vice chair of the Florida Democratic Party[98]
Eliminated in primary[edit]
- Tatiana Fernandez, businesswoman[99]
- Al Krulick, perennial candidate[99]
- Allen Pastrano, cyber engineer[99]
Declined[edit]
- Emily Bonilla, Orange County commissioner[100]
- Anna Eskamani, state representative[100] (running for re-election)[101] (endorsed Green)[102]
- Chris King, financial executive and nominee for lieutenant governor in 2018[100]
- Stephanie Murphy, incumbent U.S. representative and co-chair of the Blue Dog Coalition[103]
- Carlos Guillermo Smith, state representative[100] (endorsed Green)[102]
Endorsements[edit]
- State legislators
- Anna Eskamani, state representative[102]
- Carlos Guillermo Smith, state representative[102]
- Victor M. Torres Jr., state senator[102]
Results[edit]

- Green—40-50%
| Party | Candidate | Votes | % | |
|---|---|---|---|---|
| Democratic | Karen Green | 23,051 | 44.9 | |
| Democratic | Al Krulick | 10,787 | 21.0 | |
| Democratic | Tatiana Fernandez | 10,261 | 20.0 | |
| Democratic | Allek Pastrana | 7,289 | 14.2 | |
| Total votes | 51,388 | 100.0 | ||
Republican primary[edit]
Candidates[edit]
Nominee[edit]
Eliminated in primary[edit]
- Erika Benfield, former DeBary city commissioner[105]
- Brady Duke, pastor and former Navy SEAL[106]
- Ted Edwards, former Orange County commissioner[107]
- Rusty Roberts, former chief of staff for former U.S. Representative John Mica[108]
- Anthony Sabatini, state representative[109]
- Armando Santos, businessman
- Scott Sturgill, businessman[110]
Withdrawn[edit]
- Kevin John "Mac" McGovern, retired U.S. Navy captain[111][112][108] (running in the 15th district)[113]
- Kristopher Stark, real estate agent[108]
Declined[edit]
- Mark Busch, vice mayor of Casselberry and candidate for this district in 2016[114]
- Lee Constantine, Seminole County Commissioner (District 3), former state senator and state representative[115][116]
Endorsements[edit]
- U.S. representatives
- Dan Crenshaw, U.S. representative from Texas's 2nd congressional district (2019–present)[117]
- U.S. senators
- Ted Cruz, U.S. senator from Texas (2013–present)[118]
- U.S. representatives
- Brian Babin, U.S. representative from Texas's 36th congressional district (2015–present)[119]
- Jim Banks, U.S. representative from Indiana's 3rd congressional district (2017–present)[120]
- Gus Bilirakis, U.S. representative from Florida's 12th congressional district (2013–present)[120]
- Neal Dunn, U.S. representative from Florida's 2nd congressional district (2017–present)[121]
- Mayra Flores, U.S. representative from Texas's 34th congressional district (2022–2023)[122]
- Ronny Jackson, U.S. representative from Texas's 13th congressional district (2021–present)[120]
- Jim Jordan, U.S. representative from Ohio's 7th congressional district (2007–present)[123]
- Brian Mast, U.S. representative from Florida's 18th congressional district (2017–present)[121]
- Markwayne Mullin, U.S. representative from Oklahoma's 2nd congressional district (2013–present)[121]
- Troy Nehls, U.S. representative from Texas's 22nd congressional district (2021–present)[124]
- John Rutherford, U.S. representative from Florida's 4th congressional district (2017–present)[120]
- Pete Sessions, U.S. representative from Texas's 17th congressional district (2021–present)[124]
- Greg Steube, U.S. representative from Florida's 17th congressional district (2019–present)[121]
- Beth Van Duyne, U.S. representative from Texas's 24th congressional district (2021–present)[124]
- Organizations
- American Conservative Union[125]
- Conservative Political Action Conference[126]
- Veterans for America First[127]
- U.S. representatives
- John Mica, former U.S. representative for this district (1993–2017)[128]
- Joe Walsh, former U.S. representative from Illinois's 8th congressional district (2011–2013)[129]
- Labor unions
- Coastal Florida Police Benevolent Association[130]
- U.S. Executive Branch officials
- U.S. senators
- Rand Paul, U.S. senator from Kentucky (2011–present)[132]
- U.S. representatives
- Andy Biggs, U.S. representative from Arizona's 5th congressional district (2016–present)[133]
- Dan Bishop, U.S. representative from North Carolina's 9th congressional district (2019–present)[134]
- Madison Cawthorn, U.S. representative from North Carolina's 11th congressional district (2021–present)[124]
- Matt Gaetz, U.S. representative from Florida's 1st congressional district (2017–present)[135]
- Louie Gohmert, U.S. representative from Texas's 1st congressional district (2005–present)[136]
- Paul Gosar, U.S. representative from Arizona's 4th congressional district (2011–present)[137]
- Marjorie Taylor Greene, U.S. representative from Georgia's 14th congressional district (2021–present)[124]
- Thomas Massie, U.S. representative from Kentucky's 4th congressional district (2012–present)[138]
- Ron Paul, former U.S. representative for Texas's 22nd congressional district (1976–1977, 1979–1985) and Texas's 14th congressional district (1997–2013)[139]
- Individuals
- Roger Stone, conservative political consultant[140]
- Organizations
Polling[edit]
| Poll source | Date(s) administered | Sample size[a] | Margin of error | Erika Benfield | Brady Duke | Ted Edwards | Cory Mills | Rusty Roberts | Anthony Sabatini | Armando Santos | Scott Sturgill | Undecided |
|---|---|---|---|---|---|---|---|---|---|---|---|---|
| St. Pete Polls | August 17, 2022 | 277 (LV) | ± 5.9% | 5% | 16% | 5% | 24% | 7% | 22% | 2% | 3% | 16% |
| St. Pete Polls | August 5, 2022 | 205 (LV) | ± 6.8% | 5% | 12% | 5% | 23% | 9% | 22% | 3% | 3% | 18% |
| RMG Research | July 6–13, 2022 | 300 (LV) | ± 5.7% | 2% | 9% | 1% | 16% | 0% | 23% | – | 5% | 42% |
| Kurt Jetta (R)[B] | March 4 – July 9, 2022 | 311 (RV) | ± 5.6% | 3% | 3% | – | 17% | 9% | 7% | 5% | 4% | 51% |
| The Tyson Group (R)[A] | July 5–7, 2022 | 400 (LV) | ± 4.9% | 2% | 8% | 1% | 23% | 1% | 21% | 1% | 3% | 40% |
| St. Pete Polls | March 28, 2022 | 285 (LV) | ± 5.8% | 6% | 8% | – | 13% | 8% | 12% | – | – | 53% |
| Poll source | Date(s) administered | Sample size[a] | Margin of error | Erika Benfield | Lee Constantine | Brady Duke | Cory Mills | Rusty Roberts | Anthony Sabatini | Undecided |
|---|---|---|---|---|---|---|---|---|---|---|
| St. Pete Polls | March 28, 2022 | 285 (LV) | ± 5.8% | 7% | 23% | 4% | 12% | 5% | 9% | 39% |
Results[edit]

- Mills—40-50%
- Mills—<30%
| Party | Candidate | Votes | % | |
|---|---|---|---|---|
| Republican | Cory Mills | 27,757 | 37.9 | |
| Republican | Anthony Sabatini | 17,332 | 23.7 | |
| Republican | Brady Duke | 11,221 | 15.3 | |
| Republican | Ted Edwards | 4,259 | 5.8 | |
| Republican | Rusty Roberts | 4,031 | 5.5 | |
| Republican | Erika Benfield | 3,964 | 5.4 | |
| Republican | Scott Sturgill | 3,094 | 4.2 | |
| Republican | Armando Santos | 1,504 | 2.1 | |
| Total votes | 73,162 | 100.0 | ||
General election[edit]
Predictions[edit]
| Source | Ranking | As of |
|---|---|---|
| The Cook Political Report[27] | Solid R (flip) | October 5, 2022 |
| Inside Elections[28] | Likely R (flip) | May 17, 2022 |
| Sabato's Crystal Ball[29] | Safe R (flip) | July 28, 2022 |
| Politico[30] | Likely R (flip) | October 18, 2022 |
| RCP[31] | Likely R (flip) | June 9, 2022 |
| Fox News[32] | Solid R (flip) | July 11, 2022 |
| DDHQ[33] | Solid R (flip) | July 20, 2022 |
| 538[34] | Solid R (flip) | June 30, 2022 |
| The Economist[35] | Safe R (flip) | September 28, 2022 |
Results[edit]
| Party | Candidate | Votes | % | |
|---|---|---|---|---|
| Republican | Cory Mills | 177,966 | 58.5 | |
| Democratic | Karen Green | 126,079 | 41.5 | |
| Independent | Cardon Pompey (write-in) | 10 | 0.0 | |
| Total votes | 304,055 | 100.0 | ||
| Republican gain from Democratic | ||||
District 8[edit]
| |||||||||||||||||
| |||||||||||||||||


 French
 Deutsch


