
 French
 Deutsch
Barrier layer (oceanography)

The Barrier layer in the ocean is a layer of water separating the well-mixed surface layer from the thermocline.[1]
Barrier layer thickness (BLT)[edit]
The thickness of the barrier layer is defined as the difference between mixed layer depth (MLD) calculated from temperature minus the mixed layer depth calculated using density. The first reference to this difference as the barrier layer was in a paper describing observations in the western Pacific as part of the Western Equatorial Pacific Ocean Circulation Study.[2] In regions where the barrier layer is present, stratification is stable because of strong buoyancy forcing associated with a fresh lens sitting on top of the water column.
In the past, a typical criterion for MLD was the depth at which the surface temperature cools by 0.2 °C (see e.g. DT-02 in the Figure). Prior to the subsurface salinity available from Argo, this was the main methodology for calculating the oceanic MLD. More recently, a density criterion has been used to define the MLD, defined as the depth where the density increases from the surface value due to a prescribed temperature decrease of 0.2 °C from the surface value while maintaining constant surface salinity value. In the Figure, this is defined by Dsigma and corresponds to an isothermal/isohaline layer. The BLT is the difference of the temperature-defined MLD minus the density-defined value (i.e. DT-02 - Dsigma).
BLT Regimes[edit]
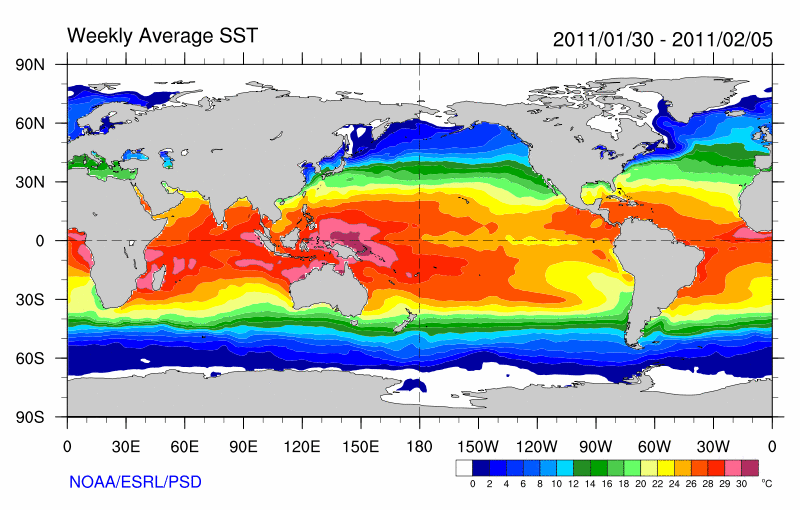
Large values of the BLT are typically found in the equatorial regions and can be as high as 50 m. Above the barrier layer, the well mixed layer may be due to local precipitation exceeding evaporation (e.g. in the western Pacific), monsoon related river runoff (e.g. in the northern Indian Ocean), or advection of salty water subducted in the subtropics (found in all subtropical ocean gyres). BLT formation in the subtropics is associated with seasonal change in the mixed layer depth, a sharper gradient in sea surface salinity (SSS) than normal, and subduction across this SSS front.[3] In particular, BLT is formed in winter season in the equatorward flank of subtropical salinity maxima. During early winter, the atmosphere cools the surface and strong wind and negative buoyancy forcing mixes temperature to a deep layer. At this same time, fresh surface salinity is advected from the rainy regions in the tropics. The deep temperature layer along with strong stratification in the salinity gives the conditions for BLT formation.[4] For the western Pacific, the mechanism for BLT formation is different. Along the equator, the eastern edge of the warm pool (typically 28 °C isotherm - see SST plot in the western Pacific) is a demarcation region between warm fresh water to the west and cold, salty, upwelled water in the central Pacific. A barrier layer is formed in the isothermal layer when salty water is subducted from the east into the warm pool due to local convergence and warm fresh water overrides denser water to the east. Here, weak winds, heavy precipitation, eastward advection of low salinity water, westward subduction of salty water and downwelling equatorial Kelvin or Rossby waves are factors that contribute to deep BLT formation.[5]
Significance of BLT[edit]
Prior to El Nino, the warm pool stores heat and is confined to the far western Pacific. During the El Nino, the warm pool migrates eastward along with the concomitant precipitation and current anomalies. The fetch of the westerlies is increased during this time, reinforcing the event. Using data from ship of opportunity and Tropical Atmosphere – Ocean (TAO) moorings in the western Pacific, the east and west migration of the warm pool was tracked over 1992-2000 using sea surface salinity (SSS), sea surface temperature (SST), currents, and subsurface data on conductivity as a function of temperature and depth taken on various research cruises.[6] This work showed that during westward flow, the BLT in the western Pacific along the equator (138oE-145oE, 2oN-2oS) was between 18 m – 35 m corresponding with warm SST and serving as an efficient storage mechanism for heat. BLT formation is driven by westward (i.e. converging and subducting) currents along the equator near the eastern edge of the salinity front that defines the warm pool. These westward currents are driven by downwelling Rossby waves and represent either a westward advection of BLT or a preferential deepening of the deeper thermocline versus the shallower halocline due to Rossby wave dynamics (i.e. these waves favor vertical stretching of the upper water column). During El Nino, westerly winds drive the warm pool eastward allowing fresh water to ride on top of the local colder/saltier/denser water to the east.
Using coupled, atmospheric/ocean models and tuning the mixing to eliminate BLT for one year prior to El Nino, it was shown that the heat buildup associated with BLT is a requirement for big El Nino.[7] It has been shown that there is a tight relationship between SSS and SST in the western Pacific and the barrier layer is instrumental in maintaining heat and momentum in the warm pool within the salinity stratified layer.[8] Later work, including Argo drifters, confirm the relationship between eastward migration of the warm pool during El Nino and BLT heat storage in the western Pacific.[4] The main impact of BLT is to maintain a shallow mixed layer allowing an enhanced air-sea coupled response. In addition, the BLT is the key factor in establishing the mean state that is perturbed during El Nino/La Nina[9]
References[edit]
- ^ Sprintall, J., and M. Tomczak, Evidence of the barrier layer in the surface-layer of the tropics, Journal of Geophysical Research-Oceans, 97 (C5), 7305-7316, 1992.
- ^ Lukas, R., and E. Lindstrom, The Mixed Layer of the Western Equatorial Pacific-Ocean, Journal of Geophysical Research-Oceans, 96, 3343-3357, 1991
- ^ Sato, K., T. Suga, and K. Hanawa, Barrier layers in the subtropical gyres of the world's oceans, Geophysical Research Letters, 33 (8), 2006.
- ^ a b Mignot, J., C.d.B. Montegut, A. Lazar, and S. Cravatte, Control of salinity on the mixed layer depth in the world ocean: 2. Tropical areas, Journal of Geophysical Research-Oceans, 112 (C10), 2007.
- ^ Bosc, C., T. Delcroix, and C. Maes, Barrier layer variability in the western Pacific warm pool from 2000 to 2007, Journal of Geophysical Research-Oceans, 114, 2009.
- ^ Delcroix, T., and M. McPhaden, Interannual sea surface salinity and temperature changes in the western Pacific warm pool during 1992-2000, Journal of Geophysical Research-Oceans, 107 (C12), 2002.
- ^ Maes, C., J. Picaut, and S. Belamari, Importance of the salinity barrier layer for the buildup of El Niño, Journal of Climate, 18 (1), 104-118, 2005.
- ^ Maes, C., K. Ando, T. Delcroix, W.S. Kessler, M.J. McPhaden, and D. Roemmich, Observed correlation of surface salinity, temperature and barrier layer at the eastern edge of the western Pacific warm pool, Geophysical Research Letters, 33 (6), 2006.
- ^ Maes, C., and S. Belamari, On the Impact of Salinity Barrier Layer on the Pacific Ocean Mean State and ENSO, Sola, 7, 97-100, 2011.