
 French
 Deutsch
Climate change feedbacks

Climate change feedbacks are natural processes that impact how much global temperatures will increase for a given amount of greenhouse gas emissions. Positive feedbacks amplify global warming while negative feedbacks diminish it.[2]: 2233 Feedbacks influence both the amount of greenhouse gases in the atmosphere and the amount of temperature change that happens in response. While emissions are the forcing that causes climate change, feedbacks combine to control climate sensitivity to that forcing.[3]: 11
While the overall sum of feedbacks is negative, it is becoming less negative as greenhouse gas emissions continue. This means that warming is slower than it would be in the absence of feedbacks, but that warming will accelerate if emissions continue at current levels.[4]: 95–96 Net feedbacks will stay negative largely because of increased thermal radiation as the planet warms, which is an effect that is several times larger than any other singular feedback.[4]: 96 Accordingly, anthropogenic climate change alone cannot cause a runaway greenhouse effect.[5][6]
Feedbacks can be divided into physical feedbacks and partially biological feedbacks. Physical feedbacks include decreased surface reflectivity (from diminished snow and ice cover) and increased water vapor in the atmosphere. Water vapor is not only a powerful greenhouse gas, it also influences feedbacks in the distribution of clouds and temperatures in the atmosphere. Biological feedbacks are mostly associated with changes to the rate at which plant matter accumulates CO2 as part of the carbon cycle.[7]: 967 The carbon cycle absorbs more than half of CO2 emissions every year into plants and into the ocean.[8]: 676 Over the long term the percentage will be reduced as carbon sinks become saturated and higher temperatures lead to effects like drought and wildfires.[8]: 698 [4]: 96 [3]: 20
Feedback strengths and relationships are estimated through global climate models, with their estimates calibrated against observational data whenever possible.[4]: 967 Some feedbacks rapidly impact climate sensitivity, while the feedback response from ice sheets is drawn out over several centuries.[7]: 967 Feedbacks can also result in localized differences, such as polar amplification resulting from feedbacks that include reduced snow and ice cover. While basic relationships are well understood, feedback uncertainty exists in certain areas, particularly regarding cloud feedbacks.[9][10] Carbon cycle uncertainty is driven by the large rates at which CO2 is both absorbed into plants and released when biomass burns or decays. For instance, permafrost thaw produces both CO2 and methane emissions in ways that are difficult to model.[8]: 677 Climate change scenarios use models to estimate how Earth will respond to greenhouse gas emissions over time, including how feedbacks will change as the planet warms.[11]
Definition and terminology
[edit]The Planck response is the additional thermal radiation objects emit as they get warmer. Whether Planck response is a climate change feedback depends on the context. In climate science the Planck response can be treated as an intrinsic part of warming that is separate from radiative feedbacks and carbon cycle feedbacks. However, the Planck response is included when calculating climate sensitivity.[4]: 95–96
A feedback that amplifies an initial change is called a positive feedback[12] while a feedback that reduces an initial change is called a negative feedback.[12] Climate change feedbacks are in the context of global warming, so positive feedbacks enhance warming and negative feedbacks diminish it. Naming a feedback positive or negative does not imply that the feedback is good or bad.[13]
The initial change that triggers a feedback may be externally forced, or may arise through the climate system's internal variability.[2]: 2222 External forcing refers to "a forcing agent outside the climate system causing a change in the climate system"[2]: 2229 that may push the climate system in the direction of warming or cooling.[14][15] External forcings may be human-caused (for example, greenhouse gas emissions or land use change) or natural (for example, volcanic eruptions).[2]: 2229
Physical feedbacks
[edit]Planck response (negative)
[edit]_at_the_top_of_the_atmosphere_(TOA).png)
Planck response is "the most fundamental feedback in the climate system".[18]: 19 As the temperature of a black body increases, the emission of infrared radiation increases with the fourth power of its absolute temperature according to the Stefan–Boltzmann law. This increases the amount of outgoing radiation back into space as the Earth warms.[17] It is a strong stabilizing response and has sometimes been called the "no-feedback response" because it is an intensive property of a thermodynamic system when considered to be purely a function of temperature.[19] Although Earth has an effective emissivity less than unity, the ideal black body radiation emerges as a separable quantity when investigating perturbations to the planet's outgoing radiation.
The Planck "feedback" or Planck response is the comparable radiative response obtained from analysis of practical observations or global climate models (GCMs). Its expected strength has been most simply estimated from the derivative of the Stefan-Boltzmann equation as −4σT3 = −3.8 W/m2/K (watts per square meter per degree of warming).[17][19] Accounting from GCM applications has sometimes yielded a reduced strength, as caused by extensive properties of the stratosphere and similar residual artifacts subsequently identified as being absent from such models.[19]
Most extensive "grey body" properties of Earth that influence the outgoing radiation are usually postulated to be encompassed by the other GCM feedback components, and to be distributed in accordance with a particular forcing-feedback formulation of the climate system.[20] Ideally the Planck response strength obtained from GCMs, indirect measurements, and black body estimates will further converge as analysis methods continue to mature.[19]
Water vapor feedback (positive)
[edit]According to Clausius–Clapeyron relation, saturation vapor pressure is higher in a warmer atmosphere, and so the absolute amount of water vapor will increase as the atmosphere warms. It is sometimes also called the specific humidity feedback,[7]: 969 because relative humidity (RH) stays practically constant over the oceans, but it decreases over land.[22] This occurs because land experiences faster warming than the ocean, and a decline in RH has been observed after the year 2000.[4]: 86
Since water vapor is a greenhouse gas, the increase in water vapor content makes the atmosphere warm further, which allows the atmosphere to hold still more water vapor. Thus, a positive feedback loop is formed, which continues until the negative feedbacks bring the system to equilibrium.[7]: 969 Increases in atmospheric water vapor have been detected from satellites, and calculations based on these observations place this feedback strength at 1.85 ± 0.32 m2/K. This is very similar to model estimates, which are at 1.77 ± 0.20 m2/K[7]: 969 Either value effectively doubles the warming that would otherwise occur from CO2 increases alone.[23] Like with the other physical feedbacks, this is already accounted for in the warming projections under climate change scenarios.[11]
Lapse rate (negative)
[edit]
The lapse rate is the rate at which an atmospheric variable, normally temperature in Earth's atmosphere, falls with altitude.[25][26] It is therefore a quantification of temperature, related to radiation, as a function of altitude, and is not a separate phenomenon in this context. The lapse rate feedback is generally a negative feedback. However, it is in fact a positive feedback in polar regions where it strongly contributed to polar amplified warming, one of the biggest consequences of climate change.[27] This is because in regions with strong inversions, such as the polar regions, the lapse rate feedback can be positive because the surface warms faster than higher altitudes, resulting in inefficient longwave cooling.[28][29][30]
The atmosphere's temperature decreases with height in the troposphere. Since emission of infrared radiation varies with temperature, longwave radiation escaping to space from the relatively cold upper atmosphere is less than that emitted toward the ground from the lower atmosphere. Thus, the strength of the greenhouse effect depends on the atmosphere's rate of temperature decrease with height. Both theory and climate models indicate that global warming will reduce the rate of temperature decrease with height, producing a negative lapse rate feedback that weakens the greenhouse effect.[28]
Surface albedo feedback (positive)
[edit]

Albedo is the measure of how strongly the planetary surface can reflect solar radiation, which prevents its absorption and thus has a cooling effect. Brighter and more reflective surfaces have a high albedo and darker surfaces have a low albedo, so they heat up more. The most reflective surfaces are ice and snow, so surface albedo changes are overwhelmingly associated with what is known as the ice-albedo feedback. A minority of the effect is also associated with changes in physical oceanography, soil moisture and vegetation cover.[7]: 970
The presence of ice cover and sea ice makes the North Pole and the South Pole colder than they would have been without it.[31] During glacial periods, additional ice increases the reflectivity and thus lowers absorption of solar radiation, cooling the planet.[32] But when warming occurs and the ice melts, darker land or open water takes its place and this causes more warming, which in turn causes more melting. In both cases, a self-reinforcing cycle continues until an equilibrium is found.[33][34] Consequently, recent Arctic sea ice decline is a key reason behind the Arctic warming nearly four times faster than the global average since 1979 (the start of continuous satellite readings), in a phenomenon known as Arctic amplification.[35][36] Conversely, the high stability of ice cover in Antarctica, where the East Antarctic ice sheet rises nearly 4 km above the sea level, means that it has experienced very little net warming over the past seven decades.[37][38][39][40]

As of 2021, the total surface feedback strength is estimated at 0.35 [0.10 to 0.60] W m2/K.[4]: 95 On its own, Arctic sea ice decline between 1979 and 2011 was responsible for 0.21 (W/m2) of radiative forcing. This is equivalent to a quarter of impact from CO2 emissions over the same period.[34] The combined change in all sea ice cover between 1992 and 2018 is equivalent to 10% of all the anthropogenic greenhouse gas emissions.[41] Ice-albedo feedback strength is not constant and depends on the rate of ice loss - models project that under high warming, its strength peaks around 2100 and declines afterwards, as most easily melted ice would already be lost by then.[42]
When CMIP5 models estimate a total loss of Arctic sea ice cover from June to September (a plausible outcome under higher levels of warming), it increases the global temperatures by 0.19 °C (0.34 °F), with a range of 0.16–0.21 °C, while the regional temperatures would increase by over 1.5 °C (2.7 °F). These calculations include second-order effects such as the impact from ice loss on regional lapse rate, water vapor and cloud feedbacks,[43] and do not cause "additional" warming on top of the existing model projections.[44]
Cloud feedback (positive)
[edit]
Seen from below, clouds emit infrared radiation back to the surface, which has a warming effect; seen from above, clouds reflect sunlight and emit infrared radiation to space, leading to a cooling effect. Low clouds are bright and very reflective, so they lead to strong cooling, while high clouds are too thin and transparent to effectively reflect sunlight, so they cause overall warming.[46] As a whole, clouds have a substantial cooling effect.[7]: 1022 However, climate change is expected to alter the distribution of cloud types in a way which collectively reduces their cooling and thus accelerates overall warming.[7]: 975 While changes to clouds act as a negative feedback in some latitudes,[24] they represent a clear positive feedback on a global scale.[4]: 95
As of 2021, cloud feedback strength is estimated at 0.42 [–0.10 to 0.94] W m2/K.[4]: 95 This is the largest confidence interval of any climate feedback, and it occurs because some cloud types (most of which are present over the oceans) have been very difficult to observe, so climate models don't have as much data to go on with when they attempt to simulate their behaviour.[7]: 975 Additionally, clouds have been strongly affected by aerosol particles, mainly from the unfiltered burning of sulfur-rich fossil fuels such as coal and bunker fuel. Any estimate of cloud feedback needs to disentangle the effects of so-called global dimming caused by these particles as well.[47][48]
Thus, estimates of cloud feedback differ sharply between climate models. Models with the strongest cloud feedback have the highest climate sensitivity, which means that they simulate much stronger warming in response to a doubling of CO2 (or equivalent greenhouse gas) concentrations than the rest.[9][10] Around 2020, a small fraction of models was found to simulate so much warming as the result that they had contradicted paleoclimate evidence from fossils,[49][50] and their output was effectively excluded from the climate sensitivity estimate of the IPCC Sixth Assessment Report.[4]: 93 [51]
Biogeophysical and biogeochemical feedbacks
[edit]CO2 feedbacks (mostly negative)
[edit]
There are positive and negative climate feedbacks from Earth's carbon cycle. Negative feedbacks are large, and play a great role in the studies of climate inertia or of dynamic (time-dependent) climate change. Because they are considered relatively insensitive to temperature changes, they are sometimes considered separately or disregarded in studies which aim to quantify climate sensitivity.[20][52] Global warming projections have included carbon cycle feedbacks since the IPCC Fourth Assessment Report (AR4) in 2007.[53] While the scientific understanding of these feedbacks was limited at the time, it had improved since then.[54] These positive feedbacks include an increase in wildfire frequency and severity, substantial losses from tropical rainforests due to fires and drying and tree losses elsewhere.[8]: 698 The Amazon rainforest is a well-known example due to its enormous size and importance, and because the damage it experiences from climate change is exacerbated by the ongoing deforestation. The combination of two threats can potentially transform much or all of the rainforest to a savannah-like state,[55][56][57] although this would most likely require relatively high warming of 3.5 °C (6.3 °F).[58][59]
Altogether, carbon sinks in the land and ocean absorb around half of the current emissions. Their future absorption is dynamic. In the future, if the emissions decrease, the fraction they absorb will increase, and they will absorb up to three-quarters of the remaining emissions - yet, the raw amount absorbed will decrease from the present. On the contrary, if the emissions will increase, then the raw amount absorbed will increase from now, yet the fraction could decline to one-third by the end of the 21st century.[3]: 20 If the emissions remain very high after the 21st century, carbon sinks would eventually be completely overwhelmed, with the ocean sink diminished further and land ecosystems outright becoming a net source.[8]: 677 Hypothetically, very strong carbon dioxide removal could also result in land and ocean carbon sinks becoming net sources for several decades.[8]: 677
Role of oceans
[edit]
Following Le Chatelier's principle, the chemical equilibrium of the Earth's carbon cycle will shift in response to anthropogenic CO2 emissions. The primary driver of this is the ocean, which absorbs anthropogenic CO2 via the so-called solubility pump. At present this accounts for only about one third of the current emissions, but ultimately most (~75%) of the CO2 emitted by human activities will dissolve in the ocean over a period of centuries: "A better approximation of the lifetime of fossil fuel CO2 for public discussion might be 300 years, plus 25% that lasts forever".[61] However, the rate at which the ocean will take it up in the future is less certain, and will be affected by stratification induced by warming and, potentially, changes in the ocean's thermohaline circulation. It is believed that the single largest factor in determining the total strength of the global carbon sink is the state of the Southern Ocean - particularly of the Southern Ocean overturning circulation.[5]
Chemical weathering
[edit]Chemical weathering over the geological long term acts to remove CO2 from the atmosphere. With current global warming, weathering is increasing, demonstrating significant feedbacks between climate and Earth surface.[62] Biosequestration also captures and stores CO2 by biological processes. The formation of shells by organisms in the ocean, over a very long time, removes CO2 from the oceans.[63] The complete conversion of CO2 to limestone takes thousands to hundreds of thousands of years.[64]
Primary production through photosynthesis
[edit]
Net primary productivity of plants' and phytoplankton grows as the increased CO2 fuels their photosynthesis in what is known as the CO2 fertilization effect. Additionally, plants require less water as the atmospheric CO2 concentrations increase, because they lose less moisture to evapotranspiration through open stomata (the pores in leaves through which CO2 is absorbed). However, increased droughts in certain regions can still limit plant growth, and the warming beyond optimum conditions has a consistently negative impact. Thus, estimates for the 21st century show that plants would become a lot more abundant at high latitudes near the poles but grow much less near the tropics - there is only medium confidence that tropical ecosystems would gain more carbon relative to now. However, there is high confidence that the total land carbon sink will remain positive.[8]: 677
Non-CO2 climate-relevant gases (unclear)
[edit]
Release of gases of biological origin would be affected by global warming, and this includes climate-relevant gases such as methane, nitrous oxide or dimethyl sulfide.[66][67] Others, such as dimethyl sulfide released from oceans, have indirect effects.[68] Emissions of methane from land (particularly from wetlands) and of nitrous oxide from land and oceans are a known positive feedback.[69] I.e. long-term warming changes the balance in the methane-related microbial community within freshwater ecosystems so they produce more methane while proportionately less is oxidised to carbon dioxide.[70] There would also be biogeophysical changes which affect the albedo. For instance, larch in some sub-arctic forests are being replaced by spruce trees. This has a limited contribution to warming, because larch trees shed their needles in winter and so they end up more extensively covered in snow than the spruce trees which retain their dark needles all year.[71]
On the other hand, changes in emissions of compounds such sea salt, dimethyl sulphide, dust, ozone and a range of biogenic volatile organic compounds are expected to be negative overall. As of 2021, all of these non-CO2 feedbacks are believed to practically cancel each other out, but there is only low confidence, and the combined feedbacks could be up to 0.25 W m2/K in either direction.[7]: 967
Permafrost (positive)
[edit]Permafrost is not included in the estimates above, as it is difficult to model, and the estimates of its role is strongly time-dependent as its carbon pools are depleted at different rates under different warming levels.[7]: 967 Instead, it is treated as a separate process that will contribute to near-term warming, with the best estimates shown below.

Altogether, it is expected that cumulative greenhouse gas emissions from permafrost thaw will be smaller than the cumulative anthropogenic emissions, yet still substantial on a global scale, with some experts comparing them to emissions caused by deforestation.[72] The IPCC Sixth Assessment Report estimates that carbon dioxide and methane released from permafrost could amount to the equivalent of 14–175 billion tonnes of carbon dioxide per 1 °C (1.8 °F) of warming.[73]: 1237 For comparison, by 2019, annual anthropogenic emissions of carbon dioxide alone stood around 40 billion tonnes.[73]: 1237 A major review published in the year 2022 concluded that if the goal of preventing 2 °C (3.6 °F) of warming was realized, then the average annual permafrost emissions throughout the 21st century would be equivalent to the year 2019 annual emissions of Russia. Under RCP4.5, a scenario considered close to the current trajectory and where the warming stays slightly below 3 °C (5.4 °F), annual permafrost emissions would be comparable to year 2019 emissions of Western Europe or the United States, while under the scenario of high global warming and worst-case permafrost feedback response, they would approach year 2019 emissions of China.[72]
Fewer studies have attempted to describe the impact directly in terms of warming. A 2018 paper estimated that if global warming was limited to 2 °C (3.6 °F), gradual permafrost thaw would add around 0.09 °C (0.16 °F) to global temperatures by 2100,[74] while a 2022 review concluded that every 1 °C (1.8 °F) of global warming would cause 0.04 °C (0.072 °F) and 0.11 °C (0.20 °F) from abrupt thaw by the year 2100 and 2300. Around 4 °C (7.2 °F) of global warming, abrupt (around 50 years) and widespread collapse of permafrost areas could occur, resulting in an additional warming of 0.2–0.4 °C (0.36–0.72 °F).[75][76]A study published in 2024 in Nature Climate Change found that coastal erosion in the Arctic, driven by permafrost thaw, reduces the ocean's capacity to absorb carbon dioxide, thereby triggering additional carbon–climate feedbacks in the region.[77]
Long-term feedbacks
[edit]Ice sheets
[edit]
The Earth's two remaining ice sheets, the Greenland ice sheet and the Antarctic ice sheet, cover the world's largest island and an entire continent, and both of them are also around 2 km (1 mi) thick on average.[78][79] Due to this immense size, their response to warming is measured in thousands of years and is believed to occur in two stages.[7]: 977
The first stage would be the effect from ice melt on thermohaline circulation. Because meltwater is completely fresh, it makes it harder for the surface layer of water to sink beneath the lower layers, and this disrupts the exchange of oxygen, nutrients and heat between the layers. This would act as a negative feedback - sometimes estimated as a cooling effect of 0.2 °C (0.36 °F) over a 1000-year average, though the research on these timescales has been limited.[7]: 977 An even longer-term effect is the ice-albedo feedback from ice sheets reaching their ultimate state in response to whatever the long-term temperature change would be. Unless the warming is reversed entirely, this feedback would be positive.[7]: 977
The total loss of the Greenland Ice Sheet is estimated to add 0.13 °C (0.23 °F) to global warming (with a range of 0.04–0.06 °C), while the loss of the West Antarctic Ice Sheet adds 0.05 °C (0.090 °F) (0.04–0.06 °C), and East Antarctic ice sheet 0.6 °C (1.1 °F)[43] Total loss of the Greenland ice sheet would also increase regional temperatures in the Arctic by between 0.5 °C (0.90 °F) and 3 °C (5.4 °F), while the regional temperature in Antarctica is likely to go up by 1 °C (1.8 °F) after the loss of the West Antarctic ice sheet and 2 °C (3.6 °F) after the loss of the East Antarctic ice sheet.[58][59]
These estimates assume that global warming stays at an average of 1.5 °C (2.7 °F). Because of the logarithmic growth of the greenhouse effect,[4]: 80 the impact from ice loss would be larger at the slightly lower warming level of 2020s, but it would become lower if the warming proceeds towards higher levels.[43] While Greenland and the West Antarctic ice sheet are likely committed to melting entirely if the long-term warming is around 1.5 °C (2.7 °F), the East Antarctic ice sheet would not be at risk of complete disappearance until the very high global warming of 5–10 °C (9.0–18.0 °F)[58][59]
Methane hydrates
[edit]Methane hydrates or methane clathrates are frozen compounds where a large amount of methane is trapped within a crystal structure of water, forming a solid similar to ice.[80] On Earth, they generally lie beneath sediments on the ocean floors, (approximately 1,100 m (3,600 ft) below the sea level).[81] Around 2008, there was a serious concern that a large amount of hydrates from relatively shallow deposits in the Arctic, particularly around the East Siberian Arctic Shelf, could quickly break down and release large amounts of methane, potentially leading to 6 °C (11 °F) within 80 years.[82][83] Current research shows that hydrates react very slowly to warming, and that it's very difficult for methane to reach the atmosphere after dissociation on the seafloor.[84][85] Thus, no "detectable" impact on the global temperatures is expected to occur in this century due to methane hydrates.[8]: 677 Some research suggests hydrate dissociation can still cause a warming of 0.4–0.5 °C (0.72–0.90 °F) over several millennia.[86]
Mathematical formulation of global energy imbalance
[edit]Earth is a thermodynamic system for which long-term temperature changes follow the global energy imbalance (EEI stands for Earth's energy imbalance):

where ASR is the absorbed solar radiation and OLR is the outgoing longwave radiation at top of atmosphere. When EEI is positive the system is warming, when it is negative they system is cooling, and when it is approximately zero then there is neither warming or cooling. The ASR and OLR terms in this expression encompass many temperature-dependent properties and complex interactions that govern system behavior.[87]
In order to diagnose that behavior around a relatively stable equilibrium state, one may consider a perturbation to EEI as indicated by the symbol Δ. Such a perturbation is typically induced by a radiative forcing (ΔF) which can be natural or man-made. Responses within the system to either return towards the stable state, or to move further away from the stable state are called feedbacks λΔT:
- .

A feedback is a thermodynamic process while a forcing is a thermodynamic operation according to classical principles.
Collectively the feedbacks may be approximated by the linearized parameter λ and the perturbed temperature ΔT because all components of λ (assumed to be first-order to act independently and additively) are also functions of temperature, albeit to varying extents, by definition for a thermodynamic system:
- .

Some feedback components having significant influence on EEI are: = water vapor, = clouds, = surface albedo, = carbon cycle, = Planck response, and = lapse rate. All quantities are understood to be global averages, while T is usually translated to temperature at the surface because of its direct relevance to humans and much other life.[20]


The negative Planck response, being an especially strong function of temperature, is sometimes factored out to give an expression in terms of the relative feedback gains gi from other components:
- .

For example for the water vapor feedback.

Within the context of modern numerical climate modelling and analysis, the linearized formulation has limited use. One such use is to diagnose the relative strengths of different feedback mechanisms. An estimate of climate sensitivity to a forcing is then obtained for the case where the net feedback remains negative and the system reaches a new equilibrium state (ΔEEI=0) after some time has passed:[18]: 19–20
- .

Implications for climate policy
[edit]
Uncertainty over climate change feedbacks has implications for climate policy. For instance, uncertainty over carbon cycle feedbacks may affect targets for reducing greenhouse gas emissions (climate change mitigation).[89] Emissions targets are often based on a target stabilization level of atmospheric greenhouse gas concentrations, or on a target for limiting global warming to a particular magnitude. Both of these targets (concentrations or temperatures) require an understanding of future changes in the carbon cycle.[8]: 678
If models incorrectly project future changes in the carbon cycle, then concentration or temperature targets could be missed. For example, if models underestimate the amount of carbon released into the atmosphere due to positive feedbacks (e.g., due to thawing permafrost), then they may also underestimate the extent of emissions reductions necessary to meet a concentration or temperature target.[8]: 678 [90]
See also
[edit]- Climate variability and change
- Climate inertia
- Complex system
- Effects of climate change
- Parametrization (atmospheric modeling)
- Tipping points in the climate system
References
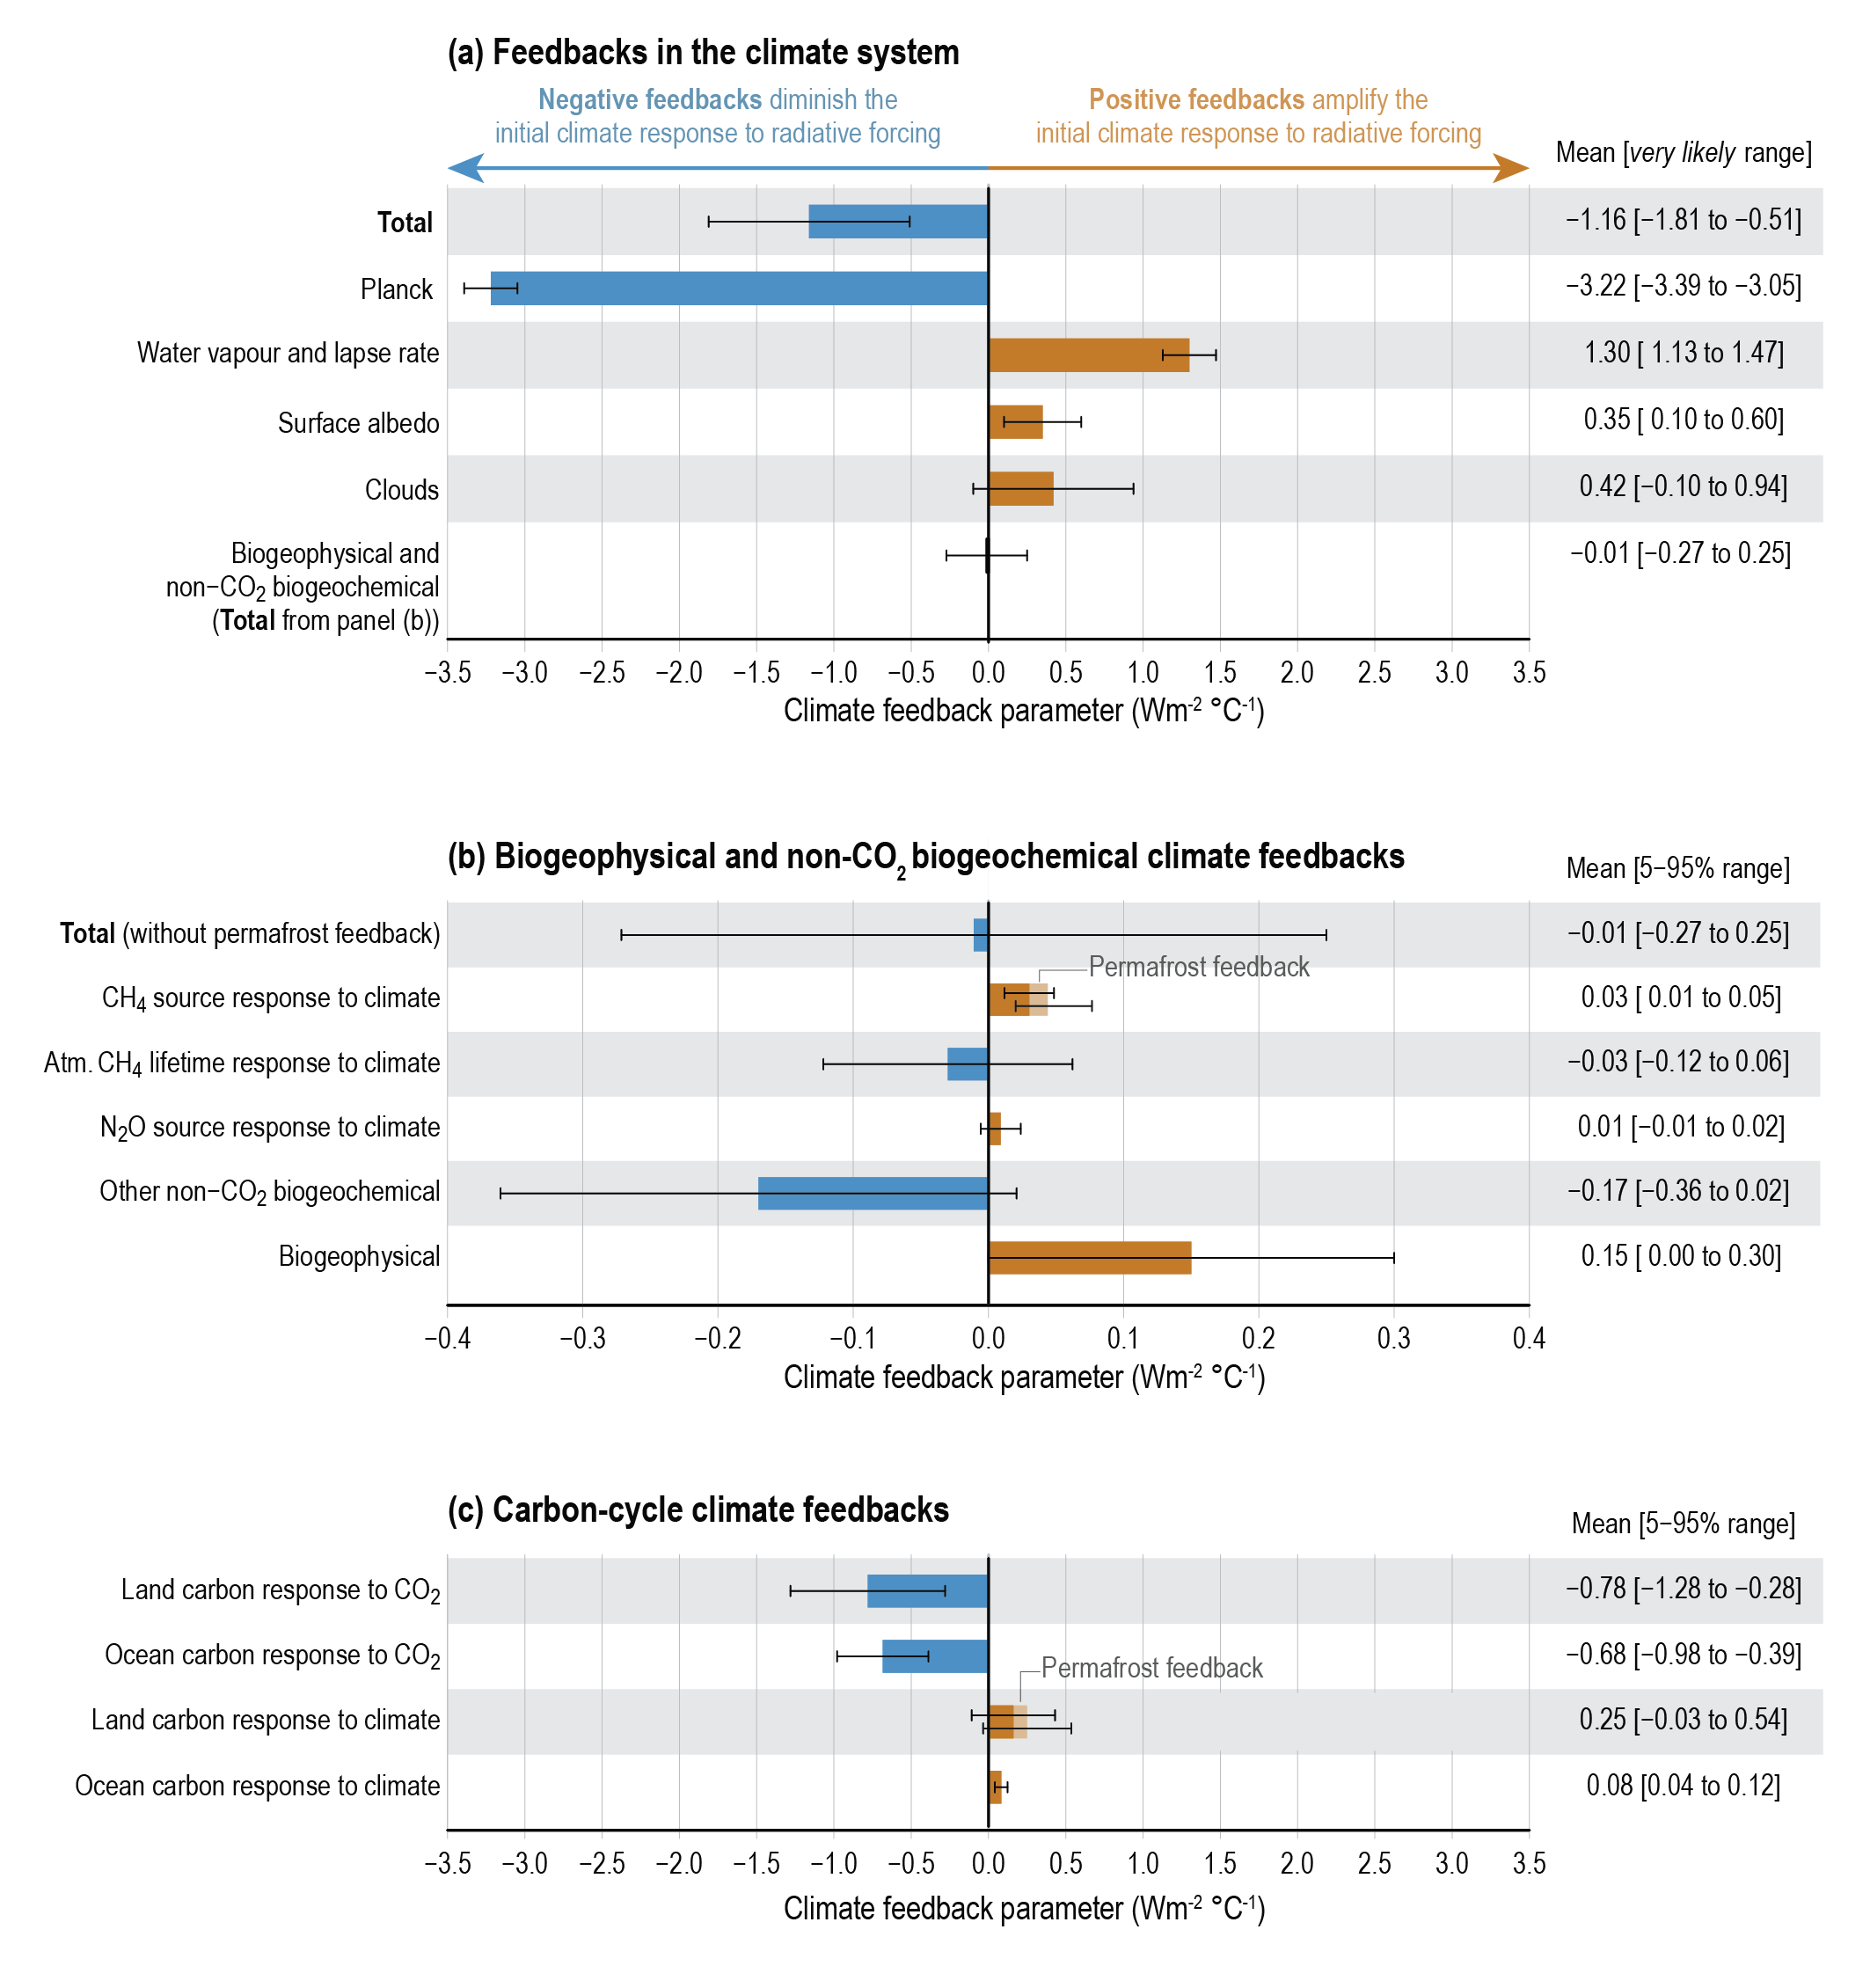
[edit]- ^ "(a) Feedbacks in the climate system / (b) Carbon-cycle climate feedbacks". IPCC.ch. Intergovernmental Panel on Climate Change. November 2022. Archived from the original on 2 May 2024. AR6 WG1 Technical Summary Fig. TS-17.
- ^ a b c d IPCC, 2021: Annex VII: Glossary [Matthews, J.B.R., V. Möller, R. van Diemen, J.S. Fuglestvedt, V. Masson-Delmotte, C. Méndez, S. Semenov, A. Reisinger (eds.)]. In Climate Change 2021: The Physical Science Basis. Contribution of Working Group I to the Sixth Assessment Report of the Intergovernmental Panel on Climate Change [Masson-Delmotte, V., P. Zhai, A. Pirani, S.L. Connors, C. Péan, S. Berger, N. Caud, Y. Chen, L. Goldfarb, M.I. Gomis, M. Huang, K. Leitzell, E. Lonnoy, J.B.R. Matthews, T.K. Maycock, T. Waterfield, O. Yelekçi, R. Yu, and B. Zhou (eds.)]. Cambridge University Press, Cambridge, United Kingdom and New York, NY, USA, pp. 2215–2256, doi:10.1017/9781009157896.022.
- ^ a b c IPCC (2021). "Summary for Policymakers" (PDF). The Physical Science Basis. Contribution of Working Group I to the Sixth Assessment Report of the Intergovernmental Panel on Climate Change. p. 40. ISBN 978-92-9169-158-6.
- ^ a b c d e f g h i j k l Arias, Paola A.; Bellouin, Nicolas; Coppola, Erika; Jones, Richard G.; Krinner, Gerhard (2021). Technical Summary (PDF). Climate Change 2021: The Physical Science Basis. Contribution of Working Group I to the Sixth Assessment Report of the Intergovernmental Panel on Climate Change (Report). Cambridge University Press, Cambridge, UK and New York, NY, US. pp. 35–144. doi:10.1017/9781009157896.009. Archived from the original (PDF) on 21 July 2022.
- ^ a b Kang, Sarah M.; Ceppi, Paulo; Yu, Yue; Kang, In-Sik (24 August 2023). "Recent global climate feedback controlled by Southern Ocean cooling". Nature Geoscience. 16 (9): 775–780. Bibcode:2023NatGe..16..775K. doi:10.1038/s41561-023-01256-6. hdl:10044/1/106429.
Net climate feedback is negative as the climate system acts to counteract the forcing; otherwise, the system would be unstable.
- ^ Scoping of the IPCC 5th Assessment Report Cross Cutting Issues (PDF). Thirty-first Session of the IPCC Bali, 26–29 October 2009 (Report). Archived (PDF) from the original on 9 November 2009. Retrieved 24 March 2019.
For instance, a "runaway greenhouse effect"—analogous to Venus--appears to have virtually no chance of being induced by anthropogenic activities.
- ^ a b c d e f g h i j k l m n Forster, P.; Storelvmo, T.; Armour, K.; Collins, W.; Dufresne, J.-L.; Frame, D.; Lunt, D.J.; Mauritsen, T.; Watanabe, M.; Wild, M.; Zhang, H. (2021). Masson-Delmotte, V.; Zhai, P.; Pirani, A.; Connors, S. L.; Péan, C.; Berger, S.; Caud, N.; Chen, Y.; Goldfarb, L. (eds.). Chapter 7: The Earth's Energy Budget, Climate Feedbacks, and Climate Sensitivity (PDF). Climate Change 2021: The Physical Science Basis. Contribution of Working Group I to the Sixth Assessment Report of the Intergovernmental Panel on Climate Change (Report). Cambridge University Press, Cambridge, UK and New York, NY, US. pp. 923–1054. doi:10.1017/9781009157896.009.
- ^ a b c d e f g h i j Canadell, J.G.; Monteiro, P.M.S.; Costa, M.H.; Cotrim da Cunha, L.; Cox, P. M.; Eliseev, A.V.; Henson, S.; Ishii, M.; Jaccard, S.; Koven, C.; Lohila, A.; Patra, P. K.; Piao, S.; Rogelj, J.; Syampungani, S.; Zaehle, S.; Zickfeld, K. (2021). Masson-Delmotte, V.; Zhai, P.; Pirani, A.; Connors, S. L.; Péan, C.; Berger, S.; Caud, N.; Chen, Y.; Goldfarb, L. (eds.). Chapter 5: Global Carbon and other Biogeochemical Cycles and Feedbacks (PDF). Climate Change 2021: The Physical Science Basis. Contribution of Working Group I to the Sixth Assessment Report of the Intergovernmental Panel on Climate Change (Report). Cambridge University Press, Cambridge, UK and New York, NY, US. pp. 673–816. doi:10.1017/9781009157896.007.
- ^ a b c Zelinka MD, Myers TA, McCoy DT, Po-Chedley S, Caldwell PM, Ceppi P, Klein SA, Taylor KE (2020). "Causes of Higher Climate Sensitivity in CMIP6 Models". Geophysical Research Letters. 47 (1): e2019GL085782. Bibcode:2020GeoRL..4785782Z. doi:10.1029/2019GL085782. hdl:10044/1/76038. ISSN 1944-8007.
- ^ a b c "Increased warming in latest generation of climate models likely caused by clouds: New representations of clouds are making models more sensitive to carbon dioxide". Science Daily. 24 June 2020. Archived from the original on 26 June 2020. Retrieved 26 June 2020.
- ^ a b Scott Johnson (September 17, 2019). "2°C is not known to be a "point of no return", as Jonathan Franzen claims". Science Feedback. Climate Feedback. Retrieved September 16, 2024.
- ^ a b "The Study of Earth as an Integrated System". nasa.gov. NASA. 2016. Archived from the original on November 2, 2016.
- ^ "Climate change and feedback loops" (PDF). National Oceanographic and Atmospheric Administration (NOAA). Archived (PDF) from the original on 25 July 2023.
- ^ US NRC (2012), Climate Change: Evidence, Impacts, and Choices / How much are human activities heating Earth, US National Research Council (US NRC), p.9. Also available as PDF Archived 2013-02-20 at the Wayback Machine
- ^ Lacis, Andrew (October 2010). "CO2: The Thermostat that Controls Earth's Temperature". NASA. Archived from the original on 20 October 2010.
- ^ von Schuckmann, Karina; Minière, Audrey.; Gues, Flora; Cuesta-Valero, Francisco José; Kirchengast, Gottfried; Adusumilli, Susheel; Straneo, Flammetta; et al. (17 April 2023). "Heat stored in the Earth system 1960-2020: where does the energy go?". Earth System Science Data. 15 (4): 1675-1709
 Material was copied from this source, which is available under a Creative Commons Attribution 4.0 International License. doi:10.5194/essd-15-1675-2023. hdl:20.500.11850/619535.
 - ^ a b c Yang, Zong-Liang. "Chapter 2: The global energy balance" (PDF). University of Texas. Retrieved 2010-02-15.
- ^ a b National Research Council Panel on Climate Change Feedbacks (2003). Understanding Climate Change Feedbacks (Free PDF download). Washington D.C., United States: National Academies Press. doi:10.17226/10850. ISBN 978-0-309-09072-8.
- ^ a b c d Cronin, Timothy W.; Dutta, Ishir (17 July 2023). "How Well Do We Understand the Planck Feedback". Journal of Advances in Modeling Earth Systems. 15 (7): 1–19. Bibcode:2023JAMES..1503729C. doi:10.1029/2023MS003729.
- ^ a b c Bony, Sandrine; Colman, Robert; Kattsov, Vladimir M.; Allan, Richard P.; Bretherton, Christopher S.; Dufresne, Jean-Louis; Hall, Alex; Hallegatte, Stephane; Holland, Marika M.; Ingram, William; Randall, David A.; Soden, Brian J.; Tseliousis, George; Webb, Mark J. (1 August 2006). "How Well Do We Understand and Evaluate Climate Change Feedback Processes?". Journal of Climate. 19 (15): 3445–3482. Bibcode:2006JCli...19.3445B. doi:10.1175/JCLI3819.1.See Appendices A and B for a more detailed review of this and similar formulations
- ^ "NASA: Climate Forcings and Global Warming". January 14, 2009. Archived from the original on 18 April 2021. Retrieved 20 April 2014.
- ^ Byrne, Michael P.; O’Gorman, Paul A. (23 April 2018). "Trends in continental temperature and humidity directly linked to ocean warming". Proceedings of the National Academy of Sciences. 115 (19): 4863–4868. doi:10.1073/pnas.1722312115. PMC 5948989.
- ^ "Science Magazine February 19, 2009" (PDF). Archived from the original (PDF) on 2010-07-14. Retrieved 2010-09-02.
- ^ a b Bonan, David B.; Feldl, Nicole; Siler, Nicholas; Kay, Jennifer E.; Armour, Kyle C.; Eisenman, Ian; Roe, Gerard H. (8 February 2024). "The Influence of Climate Feedbacks on Regional Hydrological Changes Under Global Warming". Geophysical Research Letters. 51 (3): e2023GL106648. doi:10.1029/2023GL106648.
- ^ Jacobson, Mark Zachary (2005). Fundamentals of Atmospheric Modeling (2nd ed.). Cambridge University Press. ISBN 978-0-521-83970-9.
- ^ Ahrens, C. Donald (2006). Meteorology Today (8th ed.). Brooks/Cole Publishing. ISBN 978-0-495-01162-0.
- ^ "Introduction to climate dynamics and climate modelling - Water vapour and lapse rate feedbacks". www.climate.be. Retrieved 2023-08-28.
- ^ a b Armour, Kyle C.; Bitz, Cecilia M.; Roe, Gerard H. (1 July 2013). "Time-Varying Climate Sensitivity from Regional Feedbacks". Journal of Climate. 26 (13): 4518–4534. Bibcode:2013JCli...26.4518A. doi:10.1175/jcli-d-12-00544.1. hdl:1721.1/87780. S2CID 2252857.
- ^ Goosse, Hugues; Kay, Jennifer E.; Armour, Kyle C.; Bodas-Salcedo, Alejandro; Chepfer, Helene; Docquier, David; Jonko, Alexandra; Kushner, Paul J.; Lecomte, Olivier; Massonnet, François; Park, Hyo-Seok; Pithan, Felix; Svensson, Gunilla; Vancoppenolle, Martin (15 May 2018). "Quantifying climate feedbacks in polar regions". Nature Communications. 9 (1): 1919. Bibcode:2018NatCo...9.1919G. doi:10.1038/s41467-018-04173-0. PMC 5953926. PMID 29765038.
- ^ Hahn, L. C.; Armour, K. C.; Battisti, D. S.; Donohoe, A.; Pauling, A. G.; Bitz, C. M. (28 August 2020). "Antarctic Elevation Drives Hemispheric Asymmetry in Polar Lapse Rate Climatology and Feedback". Geophysical Research Letters. 47 (16): e88965. Bibcode:2020GeoRL..4788965H. doi:10.1029/2020GL088965. S2CID 225410590.
- ^ Deser, Clara; Walsh, John E.; Timlin, Michael S. (1 February 2000). "Arctic Sea Ice Variability in the Context of Recent Atmospheric Circulation Trends". J. Climate. 13 (3): 617–633. Bibcode:2000JCli...13..617D. CiteSeerX 10.1.1.384.2863. doi:10.1175/1520-0442(2000)013<0617:ASIVIT>2.0.CO;2.
- ^ Treut, H. Le; Hansen, J.; Raynaud, D.; Jouzel, J.; Lorius, C. (September 1990). "The ice-core record: climate sensitivity and future greenhouse warming". Nature. 347 (6289): 139–145. Bibcode:1990Natur.347..139L. doi:10.1038/347139a0. ISSN 1476-4687. S2CID 4331052.
- ^ De Vrese, Philipp; Stacke, Tobias; Rugenstein, Jeremy Caves; Goodman, Jason; Brovkin, Victor (14 May 2021). "Snowfall-albedo feedbacks could have led to deglaciation of snowball Earth starting from mid-latitudes". Communications Earth & Environment. 2 (1): 91. Bibcode:2021ComEE...2...91D. doi:10.1038/s43247-021-00160-4.
- ^ a b Pistone, Kristina; Eisenman, Ian; Ramanathan, Veerabhadran (2019). "Radiative Heating of an Ice-Free Arctic Ocean". Geophysical Research Letters. 46 (13): 7474–7480. Bibcode:2019GeoRL..46.7474P. doi:10.1029/2019GL082914. ISSN 1944-8007. S2CID 197572148.
- ^ Rantanen, Mika; Karpechko, Alexey Yu; Lipponen, Antti; Nordling, Kalle; Hyvärinen, Otto; Ruosteenoja, Kimmo; Vihma, Timo; Laaksonen, Ari (11 August 2022). "The Arctic has warmed nearly four times faster than the globe since 1979". Communications Earth & Environment. 3 (1): 168. Bibcode:2022ComEE...3..168R. doi:10.1038/s43247-022-00498-3. hdl:11250/3115996. ISSN 2662-4435. S2CID 251498876.
- ^ Dai, Aiguo; Luo, Dehai; Song, Mirong; Liu, Jiping (10 January 2019). "Arctic amplification is caused by sea-ice loss under increasing CO2". Nature Communications. 10 (1): 121. Bibcode:2019NatCo..10..121D. doi:10.1038/s41467-018-07954-9. PMC 6328634. PMID 30631051.
- ^ Singh, Hansi A.; Polvani, Lorenzo M. (10 January 2020). "Low Antarctic continental climate sensitivity due to high ice sheet orography". npj Climate and Atmospheric Science. 3 (1): 39. Bibcode:2020npCAS...3...39S. doi:10.1038/s41612-020-00143-w. S2CID 222179485.
- ^ Steig, Eric; Schneider, David; Rutherford, Scott; Mann, Michael E.; Comiso, Josefino; Shindell, Drew (1 January 2009). "Warming of the Antarctic ice-sheet surface since the 1957 International Geophysical Year". Arts & Sciences Faculty Publications.
- ^ Xin, Meijiao; Li, Xichen; Stammerjohn, Sharon E; Cai, Wenju; Zhu, Jiang; Turner, John; Clem, Kyle R; Song, Chentao; Wang, Wenzhu; Hou, Yurong (17 May 2023). "A broadscale shift in antarctic temperature trends". Climate Dynamics. 61 (9–10): 4623–4641. Bibcode:2023ClDy...61.4623X. doi:10.1007/s00382-023-06825-4. S2CID 258777741.
- ^ Eric Steig; Gavin Schmidt (4 December 2004). "Antarctic cooling, global warming?". RealClimate. Retrieved 2008-01-20.
- ^ Riihelä, Aku; Bright, Ryan M.; Anttila, Kati (28 October 2021). "Recent strengthening of snow and ice albedo feedback driven by Antarctic sea-ice loss". Nature Geoscience. 14 (11): 832–836. Bibcode:2021NatGe..14..832R. doi:10.1038/s41561-021-00841-x. hdl:11250/2830682.
- ^ Andry, Olivier; Bintanja, Richard; Hazeleger, Wilco (1 January 2017). "Time-Dependent Variations in the Arctic's Surface Albedo Feedback and the Link to Seasonality in Sea Ice". Journal of Climate. 30 (1): 393–410. doi:10.1175/JCLI-D-15-0849.1.
- ^ a b c d Wunderling, Nico; Willeit, Matteo; Donges, Jonathan F.; Winkelmann, Ricarda (27 October 2020). "Global warming due to loss of large ice masses and Arctic summer sea ice". Nature Communications. 10 (1): 5177. Bibcode:2020NatCo..11.5177W. doi:10.1038/s41467-020-18934-3. PMC 7591863. PMID 33110092.
- ^ Sledd, Anne; L’Ecuyer, Tristan S. (2 December 2021). "A Cloudier Picture of Ice-Albedo Feedback in CMIP6 Models". Frontiers in Earth Science. 9: 1067. Bibcode:2021FrEaS...9.1067S. doi:10.3389/feart.2021.769844.
- ^ McKim, Brett; Bony, Sandrine; Dufresne, Jean-Louis (1 April 2024). "Weak anvil cloud area feedback suggested by physical and observational constraints". Nature Geoscience. doi:10.1038/s41561-024-01414-4.
- ^ Stephens, Graeme L. (2005-01-01). "Cloud Feedbacks in the Climate System: A Critical Review". Journal of Climate. 18 (2): 237–273. Bibcode:2005JCli...18..237S. CiteSeerX 10.1.1.130.1415. doi:10.1175/JCLI-3243.1. ISSN 0894-8755. S2CID 16122908.
- ^ "Aerosol pollution has caused decades of global dimming". American Geophysical Union. 18 February 2021. Archived from the original on 27 March 2023. Retrieved 18 December 2023.
- ^ McCoy, Daniel T.; Field, Paul; Gordon, Hamish; Elsaesser, Gregory S.; Grosvenor, Daniel P. (6 April 2020). "Untangling causality in midlatitude aerosol–cloud adjustments". Atmospheric Chemistry and Physics. 20 (7): 4085–4103. Bibcode:2020ACP....20.4085M. doi:10.5194/acp-20-4085-2020.
- ^ Zhu, Jiang; Poulsen, Christopher J.; Otto-Bliesner, Bette L. (30 April 2020). "High climate sensitivity in CMIP6 model not supported by paleoclimate". Nature Climate Change. 10 (5): 378–379. Bibcode:2020NatCC..10..378Z. doi:10.1038/s41558-020-0764-6.
- ^ Erickson, Jim (30 April 2020). "Some of the latest climate models provide unrealistically high projections of future warming". Phys.org. Retrieved 12 May 2024.
But the CESM2 model projected Early Eocene land temperatures exceeding 55 degrees Celsius (131 F) in the tropics, which is much higher than the temperature tolerance of plant photosynthesis—conflicting with the fossil evidence. On average across the globe, the model projected surface temperatures at least 6 C (11 F) warmer than estimates based on geological evidence.
- ^ Voosen, Paul (4 May 2022). "Use of 'too hot' climate models exaggerates impacts of global warming". Science Magazine. Retrieved 12 May 2024.
But for the 2019 CMIP6 round, 10 out of 55 of the models had sensitivities higher than 5°C—a stark departure. The results were also at odds with a landmark study that eschewed global modeling results and instead relied on paleoclimate and observational records to identify Earth's climate sensitivity. It found that the value sits somewhere between 2.6°C and 3.9°C.
- ^ Gregory, J.M.; Jones, C.D.; Cadule, P.; Friedlingstein, P. (2009). "Quantifying Carbon Cycle Feedbacks". Journal of Climate. 22 (19): 5232–5250. Bibcode:2009JCli...22.5232G. doi:10.1175/2009JCLI2949.1.
- ^ Meehl, G.A.; et al., "Chapter 10: Global Climate Projections", Sec 10.5.4.6 Synthesis of Projected Global Temperature at Year 2100, archived from the original on 2018-11-04, retrieved 2013-02-01, in: Climate Change 2007: The Physical Science Basis. Contribution of Working Group I to the Fourth Assessment Report of the Intergovernmental Panel on Climate Change [Solomon, S., D. Qin, M. Manning, Z. Chen, M. Marquis, K.B. Averyt, M. Tignor and H.L. Miller (eds.)]. Cambridge University Press, Cambridge, United Kingdom and New York, NY, USA.
- ^ Solomon; et al., "Technical Summary", TS.6.4.3 Global Projections: Key uncertainties, archived from the original on 2018-11-03, retrieved 2013-02-01, in in: Climate Change 2007: The Physical Science Basis. Contribution of Working Group I to the Fourth Assessment Report of the Intergovernmental Panel on Climate Change [Solomon, S., D. Qin, M. Manning, Z. Chen, M. Marquis, K.B. Averyt, M. Tignor and H.L. Miller (eds.)]. Cambridge University Press, Cambridge, United Kingdom and New York, NY, USA.
- ^ Nobre, Carlos; Lovejoy, Thomas E. (2018-02-01). "Amazon Tipping Point". Science Advances. 4 (2): eaat2340. Bibcode:2018SciA....4.2340L. doi:10.1126/sciadv.aat2340. ISSN 2375-2548. PMC 5821491. PMID 29492460.
- ^ Rammig, Anja; Wang-Erlandsson, Lan; Staal, Arie; Sampaio, Gilvan; Montade, Vincent; Hirota, Marina; Barbosa, Henrique M. J.; Schleussner, Carl-Friedrich; Zemp, Delphine Clara (2017-03-13). "Self-amplified Amazon forest loss due to vegetation-atmosphere feedbacks". Nature Communications. 8: 14681. Bibcode:2017NatCo...814681Z. doi:10.1038/ncomms14681. ISSN 2041-1723. PMC 5355804. PMID 28287104.
- ^ "Feedback Cycles: linking forests, climate and landuse activities". Woods Hole Research Center. Archived from the original on 2007-10-25. Retrieved 2007-12-02.
- ^ a b c d Armstrong McKay, David; Abrams, Jesse; Winkelmann, Ricarda; Sakschewski, Boris; Loriani, Sina; Fetzer, Ingo; Cornell, Sarah; Rockström, Johan; Staal, Arie; Lenton, Timothy (9 September 2022). "Exceeding 1.5°C global warming could trigger multiple climate tipping points". Science. 377 (6611): eabn7950. doi:10.1126/science.abn7950. hdl:10871/131584. ISSN 0036-8075. PMID 36074831. S2CID 252161375.
- ^ a b c d Armstrong McKay, David (9 September 2022). "Exceeding 1.5°C global warming could trigger multiple climate tipping points – paper explainer". climatetippingpoints.info. Retrieved 2 October 2022.
- ^ Joos, F.; Roth, R.; Fuglestvedt, J.S.; Peters, G.P.; Enting, I.G.; et al. (8 March 2013). "Carbon dioxide and climate impulse response functions for the computation of greenhouse gas metrics: A multi-model analysis". Atmospheric Chemistry and Physics. 13 (5): 2793–2825 Material was copied from this source, which is available under a Creative Commons Attribution 3.0 Unported License. doi:10.5194/acpd-12-19799-2012. hdl:20.500.11850/58316.
- ^ Archer, David (2005). "Fate of fossil fuel CO2 in geologic time" (PDF). Journal of Geophysical Research. 110 (C9): C09S05. Bibcode:2005JGRC..110.9S05A. CiteSeerX 10.1.1.364.2117. doi:10.1029/2004JC002625.
- ^ Sigurdur R. Gislason; Eric H. Oelkers; Eydis S. Eiriksdottir; Marin I. Kardjilov; Gudrun Gisladottir; Bergur Sigfusson; Arni Snorrason; Sverrir Elefsen; Jorunn Hardardottir; Peter Torssander; Niels Oskarsson (2009). "Direct evidence of the feedback between climate and weathering". Earth and Planetary Science Letters. 277 (1–2): 213–222. Bibcode:2009E&PSL.277..213G. doi:10.1016/j.epsl.2008.10.018.
- ^ "The Carbon Cycle - Earth Science - Visionlearning". Visionlearning.
- ^ "Prologue: The Long Thaw: How Humans Are Changing the Next 100,000 Years of Earth's Climate by David Archer". princeton.edu. Archived from the original on 2010-07-04. Retrieved 2010-08-09.
- ^ Hille K (25 April 2016). "Carbon Dioxide Fertilization Greening Earth, Study Finds". NASA. Retrieved 2020-12-27.
- ^ Repo, M. E.; Susiluoto, S.; Lind, S. E.; Jokinen, S.; Elsakov, V.; Biasi, C.; Virtanen, T.; Martikainen, P. J. (2009). "Large N2O emissions from cryoturbated peat soil in tundra". Nature Geoscience. 2 (3): 189. Bibcode:2009NatGe...2..189R. doi:10.1038/ngeo434.
- ^ Caitlin McDermott-Murphy (2019). "No laughing matter". The Harvard Gazette. Retrieved 22 July 2019.
- ^ Simó, R.; Dachs, J. (2002). "Global ocean emission of dimethylsulfide predicted from biogeophysical data". Global Biogeochemical Cycles. 16 (4): 1018. Bibcode:2002GBioC..16.1018S. doi:10.1029/2001GB001829. S2CID 129266687.
- ^ Dean, Joshua F.; Middelburg, Jack J.; Röckmann, Thomas; Aerts, Rien; Blauw, Luke G.; Egger, Matthias; Jetten, Mike S. M.; de Jong, Anniek E. E.; Meisel, Ove H. (2018). "Methane Feedbacks to the Global Climate System in a Warmer World". Reviews of Geophysics. 56 (1): 207–250. Bibcode:2018RvGeo..56..207D. doi:10.1002/2017RG000559. hdl:1874/366386.
- ^ Zhu, Yizhu; Purdy, Kevin J.; Eyice, Özge; Shen, Lidong; Harpenslager, Sarah F.; Yvon-Durocher, Gabriel; Dumbrell, Alex J.; Trimmer, Mark (2020-06-29). "Disproportionate increase in freshwater methane emissions induced by experimental warming". Nature Climate Change. 10 (7): 685–690. Bibcode:2020NatCC..10..685Z. doi:10.1038/s41558-020-0824-y. ISSN 1758-6798. S2CID 220261158.
- ^ University of Virginia (March 25, 2011). "Russian boreal forests undergoing vegetation change, study shows". ScienceDaily.com. Retrieved March 9, 2018.
- ^ a b c Schuur, Edward A. G.; Abbott, Benjamin W.; Commane, Roisin; Ernakovich, Jessica; Euskirchen, Eugenie; Hugelius, Gustaf; Grosse, Guido; Jones, Miriam; Koven, Charlie; Leshyk, Victor; Lawrence, David; Loranty, Michael M.; Mauritz, Marguerite; Olefeldt, David; Natali, Susan; Rodenhizer, Heidi; Salmon, Verity; Schädel, Christina; Strauss, Jens; Treat, Claire; Turetsky, Merritt (2022). "Permafrost and Climate Change: Carbon Cycle Feedbacks From the Warming Arctic". Annual Review of Environment and Resources. 47: 343–371. Bibcode:2022ARER...47..343S. doi:10.1146/annurev-environ-012220-011847. S2CID 252986002.
- ^ a b Fox-Kemper, B., H. T. Hewitt, C. Xiao, G. Aðalgeirsdóttir, S. S. Drijfhout, T. L. Edwards, N. R. Golledge, M. Hemer, R. E. Kopp, G. Krinner, A. Mix, D. Notz, S. Nowicki, I. S. Nurhati, L. Ruiz, J.-B. Sallée, A. B. A. Slangen, and Y. Yu, 2021: Chapter 9: Ocean, Cryosphere and Sea Level Change. In Climate Change 2021: The Physical Science Basis. Contribution of Working Group I to the Sixth Assessment Report of the Intergovernmental Panel on Climate Change. [Masson-Delmotte, V., P. Zhai, A. Pirani, S. L. Connors, C. Péan, S. Berger, N. Caud, Y. Chen, L. Goldfarb, M. I. Gomis, M. Huang, K. Leitzell, E. Lonnoy, J. B. R. Matthews, T. K. Maycock, T. Waterfield, O. Yelekçi, R. Yu, and B. Zhou (eds.)]. Cambridge University Press, Cambridge, United Kingdom and New York, NY, USA, pp. 1211–1362, doi:10.1017/9781009157896.011.
- ^ Schellnhuber, Hans Joachim; Winkelmann, Ricarda; Scheffer, Marten; Lade, Steven J.; Fetzer, Ingo; Donges, Jonathan F.; Crucifix, Michel; Cornell, Sarah E.; Barnosky, Anthony D. (2018). "Trajectories of the Earth System in the Anthropocene". Proceedings of the National Academy of Sciences. 115 (33): 8252–8259. Bibcode:2018PNAS..115.8252S. doi:10.1073/pnas.1810141115. ISSN 0027-8424. PMC 6099852. PMID 30082409.
- ^ Armstrong McKay, David; Abrams, Jesse; Winkelmann, Ricarda; Sakschewski, Boris; Loriani, Sina; Fetzer, Ingo; Cornell, Sarah; Rockström, Johan; Staal, Arie; Lenton, Timothy (9 September 2022). "Exceeding 1.5°C global warming could trigger multiple climate tipping points". Science. 377 (6611): eabn7950. doi:10.1126/science.abn7950. hdl:10871/131584. ISSN 0036-8075. PMID 36074831. S2CID 252161375.
- ^ Armstrong McKay, David (9 September 2022). "Exceeding 1.5°C global warming could trigger multiple climate tipping points – paper explainer". climatetippingpoints.info. Retrieved 2 October 2022.
- ^ Nielsen, David M.; Chegini, Fatemeh; Ilyina, Tatiana (12 August 2024). "Climate feedbacks from coastal erosion". Nature Climate Change. 14: 899–900. doi:10.1038/s41558-024-02089-w.
- ^ "Ice Sheets". National Science Foundation. Archived from the original on 2022-09-21. Retrieved 2024-05-14.
- ^ "About the Greenland Ice Sheet". National Snow and Ice Data Center. 21 November 2012.
- ^ Gas Hydrate: What is it?, U.S. Geological Survey, 31 August 2009, archived from the original on June 14, 2012, retrieved 28 December 2014
- ^ Roald Hoffmann (2006). "Old Gas, New Gas". American Scientist. 94 (1): 16–18. doi:10.1511/2006.57.3476.
- ^ Preuss, Paul (17 September 2008). "IMPACTS: On the Threshold of Abrupt Climate Changes". Lawrence Berkeley National Laboratory.
- ^ Atsushi Obata; Kiyotaka Shibata (June 20, 2012). "Damage of Land Biosphere due to Intense Warming by 1000-Fold Rapid Increase in Atmospheric Methane: Estimation with a Climate–Carbon Cycle Model". J. Climate. 25 (24): 8524–8541. Bibcode:2012JCli...25.8524O. doi:10.1175/JCLI-D-11-00533.1.
- ^ Wallmann; et al. (2018). "Gas hydrate dissociation off Svalbard induced by isostatic rebound rather than global warming". Nature Communications. 9 (1): 83. Bibcode:2018NatCo...9...83W. doi:10.1038/s41467-017-02550-9. PMC 5758787. PMID 29311564.
- ^ Mau, S.; Römer, M.; Torres, M. E.; Bussmann, I.; Pape, T.; Damm, E.; Geprägs, P.; Wintersteller, P.; Hsu, C.-W.; Loher, M.; Bohrmann, G. (23 February 2017). "Widespread methane seepage along the continental margin off Svalbard - from Bjørnøya to Kongsfjorden". Scientific Reports. 7: 42997. Bibcode:2017NatSR...742997M. doi:10.1038/srep42997. PMC 5322355. PMID 28230189. S2CID 23568012.
- ^ Schellnhuber, Hans Joachim; Winkelmann, Ricarda; Scheffer, Marten; Lade, Steven J.; Fetzer, Ingo; Donges, Jonathan F.; Crucifix, Michel; Cornell, Sarah E.; Barnosky, Anthony D. (2018). "Trajectories of the Earth System in the Anthropocene". Proceedings of the National Academy of Sciences. 115 (33): 8252–8259. Bibcode:2018PNAS..115.8252S. doi:10.1073/pnas.1810141115. ISSN 0027-8424. PMC 6099852. PMID 30082409.
- ^ Hansen, James; Sato, Makiko; Kharecha, Pushker; von Schuckmann, Karina (January 2012). "Earth's Energy Imbalance". NASA. Archived from the original on 2012-02-04.
- ^ Solomon S, et al. "Technical summary" (PDF). Climate Change 2007: Working Group I: The Physical Science Basis. Box TS.1: Treatment of Uncertainties in the Working Group I Assessment. Archived (PDF) from the original on 30 March 2019. Retrieved 30 March 2019.
- ^ Meehl, G.A., T.F. Stocker, W.D. Collins, P. Friedlingstein, A.T. Gaye, J.M. Gregory, A. Kitoh, R. Knutti, J.M. Murphy, A. Noda, S.C.B. Raper, I.G. Watterson, A.J. Weaver and Z.-C. Zhao, 2007: Chapter 10: Global Climate Projections. In: Climate Change 2007: The Physical Science Basis. Contribution of Working Group I to the Fourth Assessment Report of the Intergovernmental Panel on Climate Change [Solomon, S., D. Qin, M. Manning, Z. Chen, M. Marquis, K.B. Averyt, M. Tignor and H.L. Miller (eds.)]. Cambridge University Press, Cambridge, United Kingdom and New York, NY, USA. (Section 10.4.1 Carbon Cycle/Vegetation Feedbacks)
- ^ Natali, Susan M.; Holdren, John P.; Rogers, Brendan M.; Treharne, Rachael; Duffy, Philip B.; Pomerance, Rafe; MacDonald, Erin (10 December 2020). "Permafrost carbon feedbacks threaten global climate goals". Proceedings of the National Academy of Sciences. 118 (21). doi:10.1073/pnas.2100163118. PMC 8166174. PMID 34001617.