
 French
 Deutsch
File:Aliquot sums and untouchable numbers.pdf
Size of this JPG preview of this PDF file: 155 × 596 pixels. Other resolutions: 62 × 240 pixels | 360 × 1,385 pixels.
Original file (360 × 1,385 pixels, file size: 7 KB, MIME type: application/pdf)
| This is a file from the Wikimedia Commons. Information from its description page there is shown below. Commons is a freely licensed media file repository. You can help. |
Summary
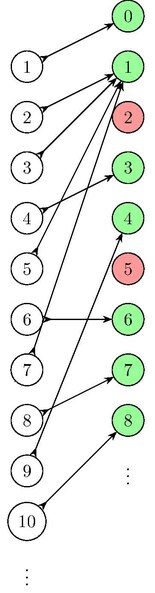
| Description | English: Diagram showing the map from positive integers to their aliquot sums (sum of all proper divisors), highlighting the "untouchable numbers" 2 and 5 that are not in the image. Source code: \documentclass{standalone} \usepackage{graphicx} % for \scalebox \usepackage{tikz} \usetikzlibrary{arrows.meta} % for more arrow tip styles \begin{document} \scalebox{2.0}{ % scale factor for Mediawiki rasterization \begin{tikzpicture}[>={Stealth}, every node/.style={circle, draw, minimum size=0.5cm}, yscale=-1] % Nodes on the left \node (L1) at (0,1) {1}; \node (L2) at (0,2) {2}; \node (L3) at (0,3) {3}; \node (L4) at (0,4) {4}; \node (L5) at (0,5) {5}; \node (L6) at (0,6) {6}; \node (L7) at (0,7) {7}; \node (L8) at (0,8) {8}; \node (L9) at (0,9) {9}; \node (L10) at (0,10) {10}; % Ellipsis \node[draw=none] at (0,11) {\vdots}; % Nodes on the right \node[fill=green!40] (R0) at (2,0) {0}; \node[fill=green!40] (R1) at (2,1) {1}; \node[fill= red!40] (R2) at (2,2) {2}; \node[fill=green!40] (R3) at (2,3) {3}; \node[fill=green!40] (R4) at (2,4) {4}; \node[fill= red!40] (R5) at (2,5) {5}; \node[fill=green!40] (R6) at (2,6) {6}; \node[fill=green!40] (R7) at (2,7) {7}; \node[fill=green!40] (R8) at (2,8) {8}; % Ellipsis \node[draw=none] at (2,9) {\vdots}; % Edges \begin{scope} \draw[>->] (L1) -- (R0); \draw[>->] (L2) -- (R1); \draw[>->] (L3) -- (R1); \draw[>->] (L4) -- (R3); \draw[>->] (L5) -- (R1); \draw[>->] (L6) -- (R6); \draw[>->] (L7) -- (R1); \draw[>->] (L8) -- (R7); \draw[>->] (L9) -- (R4); \draw[>->] (L10) -- (R8); \end{scope} \end{tikzpicture} } % end of \scalebox \end{document} |
| Date | |
| Source | Own work |
| Author | Shreevatsa |
Licensing
I, the copyright holder of this work, hereby publish it under the following license:
This file is licensed under the Creative Commons Attribution-Share Alike 4.0 International license.
- You are free:
- to share – to copy, distribute and transmit the work
- to remix – to adapt the work
- Under the following conditions:
- attribution – You must give appropriate credit, provide a link to the license, and indicate if changes were made. You may do so in any reasonable manner, but not in any way that suggests the licensor endorses you or your use.
- share alike – If you remix, transform, or build upon the material, you must distribute your contributions under the same or compatible license as the original.
File history
Click on a date/time to view the file as it appeared at that time.
| Date/Time | Thumbnail | Dimensions | User | Comment | |
|---|---|---|---|---|---|
| current | 04:40, 27 August 2023 | 360 × 1,385 (7 KB) | Shreevatsa | Used scalebox to correct for poor rasterization | |
| 03:27, 27 August 2023 | 166 × 691 (16 KB) | Shreevatsa | Uploaded while editing "Untouchable number" on en.wikipedia.org |
File usage
The following page uses this file:
Global file usage
The following other wikis use this file:
- Usage on de.wikipedia.org