File:Element abundance human body ppm chart.svg

Size of this PNG preview of this SVG file: 512 × 512 pixels. Other resolutions: 240 × 240 pixels | 480 × 480 pixels | 768 × 768 pixels | 1,024 × 1,024 pixels | 2,048 × 2,048 pixels.
Original file (SVG file, nominally 512 × 512 pixels, file size: 33 KB)
File history
Click on a date/time to view the file as it appeared at that time.
| Date/Time | Thumbnail | Dimensions | User | Comment | |
|---|---|---|---|---|---|
| current | 06:41, 10 December 2023 |  | 512 × 512 (33 KB) | Cmglee | Add figure, chemical symbols and 2 significant figures |
| 17:57, 9 December 2023 |  | 512 × 512 (31 KB) | Cmglee | Swap sulfur and potassium | |
| 17:47, 9 December 2023 |  | 512 × 512 (31 KB) | Cmglee | Align bends and add whitespace | |
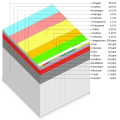
| 17:40, 9 December 2023 |  | 512 × 512 (31 KB) | Cmglee | {{Information |Description=Parts-per-million cube showing relative abundance of elements by mass in an average human body by CMG Lee. |Source={{own}} |Date= |Author= Cmglee |Permission= |other_versions= }} Category:4-3-2 trimetric projection Category:Parts-per-million chart Category:Relative abundance distribution Category:Chemical elements Category:Human body composition |
File usage
The following 2 pages use this file:
Global file usage
The following other wikis use this file:
- Usage on bn.wikipedia.org


 French
 Deutsch