
 French
 Deutsch
File:Energy Capacity Added 2000 to 2020 GW Comparison.png
Size of this preview: 800 × 484 pixels. Other resolutions: 320 × 194 pixels | 640 × 388 pixels | 1,024 × 620 pixels | 1,280 × 775 pixels | 1,833 × 1,110 pixels.
Original file (1,833 × 1,110 pixels, file size: 117 KB, MIME type: image/png)
| This is a file from the Wikimedia Commons. Information from its description page there is shown below. Commons is a freely licensed media file repository. You can help. |
Summary
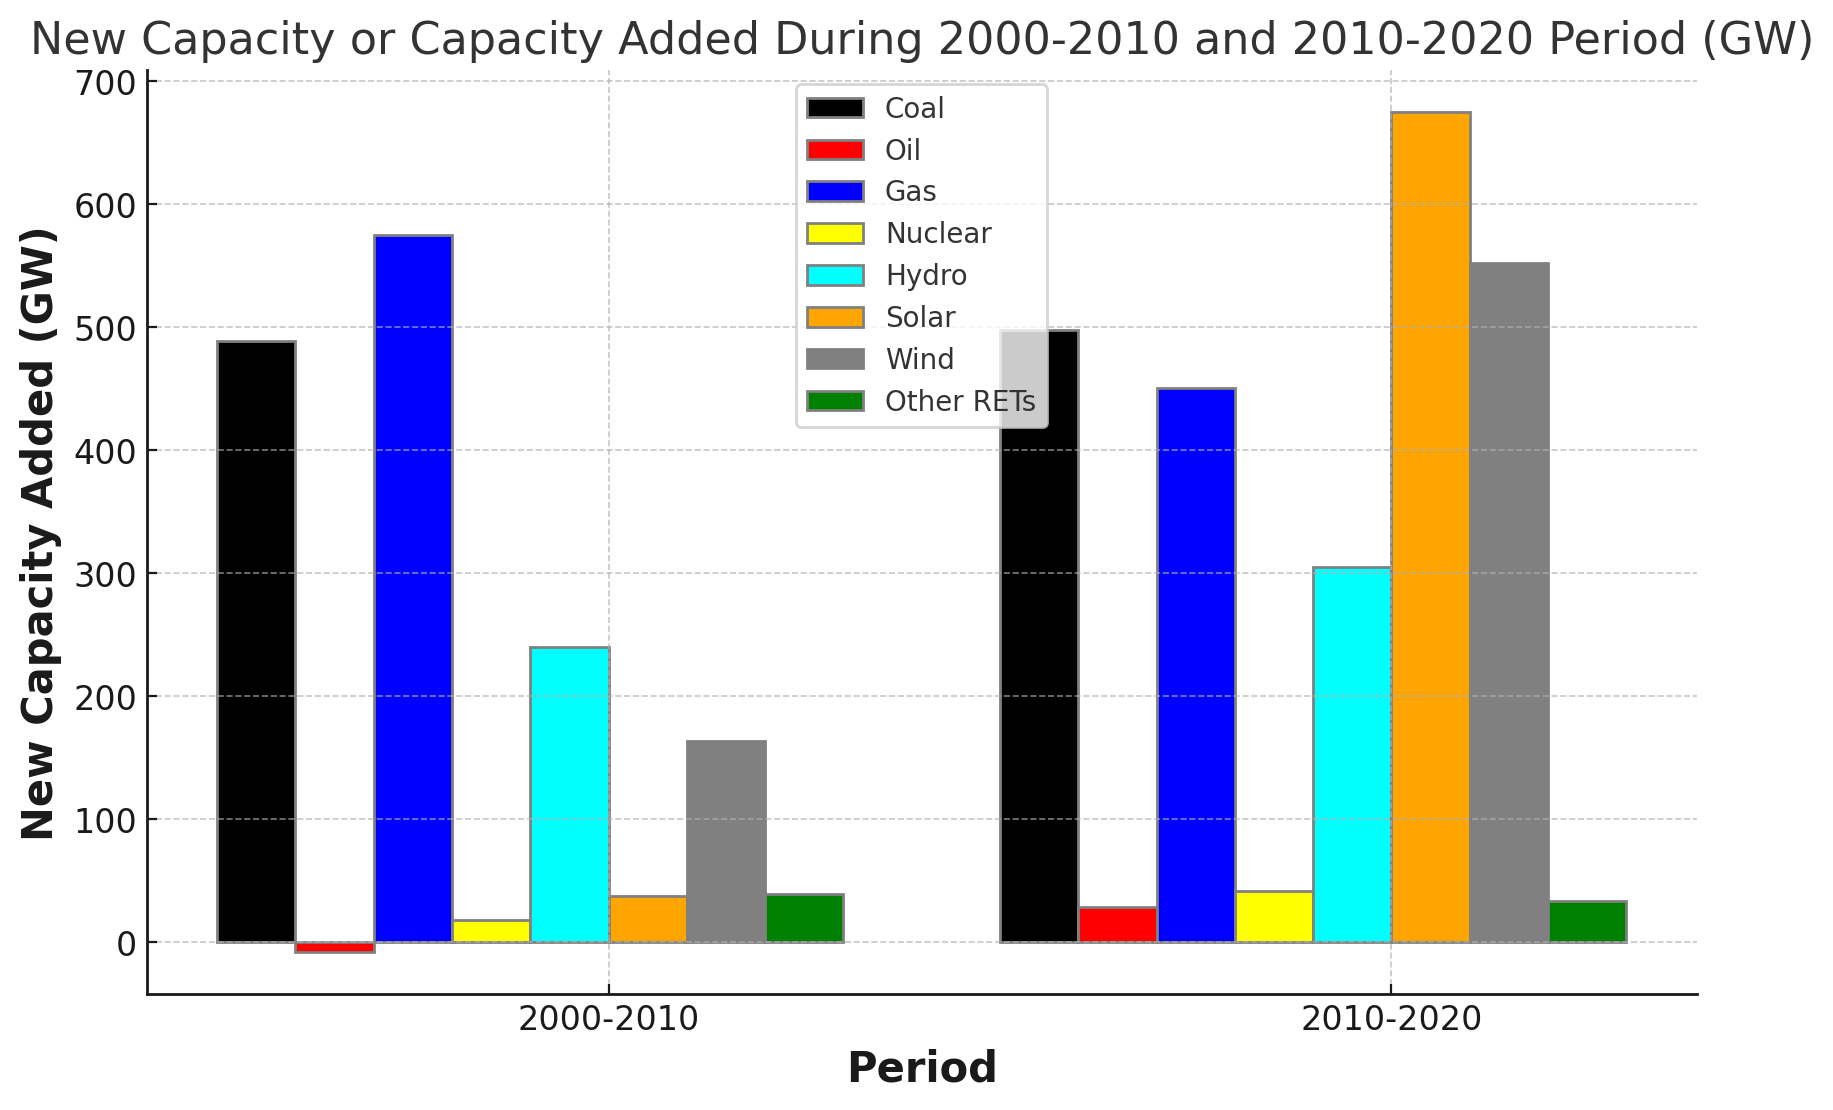
| Description | English: Vertical bar chart comparing the new capacity added, measured in gigawatts (GW), for various energy sources across two separate periods: 2000-2010 and 2010-2020 |
| Date | |
| Source | Own work |
| Author | Fabulous-Fishy |
Licensing
I, the copyright holder of this work, hereby publish it under the following license:
This file is licensed under the Creative Commons Attribution-Share Alike 4.0 International license.
- You are free:
- to share – to copy, distribute and transmit the work
- to remix – to adapt the work
- Under the following conditions:
- attribution – You must give appropriate credit, provide a link to the license, and indicate if changes were made. You may do so in any reasonable manner, but not in any way that suggests the licensor endorses you or your use.
- share alike – If you remix, transform, or build upon the material, you must distribute your contributions under the same or compatible license as the original.
 | This media file is uncategorized. Please help improve this media file by adding it to one or more categories, so it may be associated with related media files (how?), and so that it can be more easily found. Please notify the uploader with {{subst:Please link images|File:Energy Capacity Added 2000 to 2020 GW Comparison.png}} ~~~~ |
File history
Click on a date/time to view the file as it appeared at that time.
| Date/Time | Thumbnail | Dimensions | User | Comment | |
|---|---|---|---|---|---|
| current | 05:26, 16 March 2024 | | 1,833 × 1,110 (117 KB) | Fabulous-Fishy | Uploaded while editing "Clean technology" on en.wikipedia.org |
File usage
The following pages on the English Wikipedia use this file (pages on other projects are not listed):