
 French
 Deutsch
File:Estimations of Human Brain Emulation Required Performance.svg

Size of this PNG preview of this SVG file: 800 × 600 pixels. Other resolutions: 320 × 240 pixels | 640 × 480 pixels | 1,024 × 768 pixels | 1,280 × 960 pixels | 2,560 × 1,920 pixels.
Original file (SVG file, nominally 800 × 600 pixels, file size: 49 KB)
| This is a file from the Wikimedia Commons. Information from its description page there is shown below. Commons is a freely licensed media file repository. You can help. |
Summary
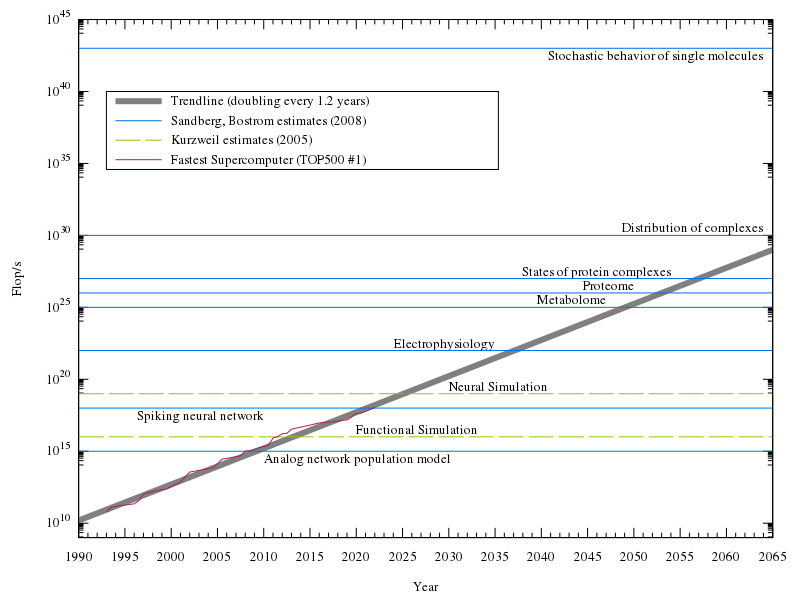
| Description | English: Estimates of how much processing power is needed to emulate a human brain at various levels, along with the fastest supercomputer from TOP500 mapped by year, and a trendline. Exponential plot, with assumption of doubling of computational power every 1.1 years for the trendline. |
| Date | |
| Source | Own work, data from [1], PPTSuperComputersPRINT.jpg, and [2]. |
| Author | Tga.D |
| SVG development | |
| Source code | Gnuplot codeset terminal svg size 800 600 fname "Times,13" set output "Estimations of Human Brain Emulation Required Performance.svg" set notitle set key reverse Left left at 1993, 10**40 noautotitles box # good chunk of whitespace to put the key in set datafile separator "," set logscale y # use a logarithmic scale, for easier visualization of exponential growth set format y "10^{%T}" set yrange[10**9:10**45] set ylabel "Flop/s" set xrange [1990:2065] set xlabel "Year" set xtics 1990,5,2065 set mxtics 5 #set grid # I think it looks better without, but it's a matter of preference # labels for each of the levels of emulation set label "Analog network population model" at 2010, 10**14.5 left set label "Spiking neural network" at 2010, 10**17.5 right set label "Electrophysiology" at 2035, 10**22.5 right set label "Metabolome" at 2047, 10**25.5 right set label "Proteome" at 2050, 10**26.5 right set label "States of protein complexes" at 2054, 10**27.5 right set label "Distribution of complexes" at 2064, 10**30.5 right set label "Stochastic behavior of single molecules" at 2064, 10**42.5 right set label "Functional Simulation" at 2020, 10**16.5 left set label "Neural Simulation" at 2030, 10**19.5 left # best-fit is as of June 2022 list, to two sigfigs # horizontal lines plotted to represent levels of emulation # plot of historical TOP500 #1's stored in a .csv # colors and sizes picked from what I thought was easiest to see # titles done for one of each type of line, for the key plot 87000000000.0*(2**((x-1993)/1.2)) lw 6 lc 0 w lines title "Trendline (doubling every 1.2 years)",\ 10**15 ls 3 lt rgb "#0073E6", \ 10**18 ls 3 lt rgb "#0073E6", \ 10**22 ls 3 lt rgb "#0073E6", \ 10**25 ls 3 lt rgb "#0073E6", \ 10**26 ls 3 lt rgb "#0073E6", \ 10**27 ls 3 lt rgb "#0073E6", \ 10**30 ls 3 lt rgb "#0073E6", \ 10**43 ls 3 lt rgb "#0073E6" title "Sandberg, Bostrom estimates (2008)",\ 10**16 ls 2 dt (50,10) lc rgb "#89CE00", \ 10**19 ls 2 dt (50,10) lt rgb "#89CE00" title "Kurzweil estimates (2005)",\ "TOP500.csv" using 1:2 ls 1 lt rgb "#B51963" pt 7 ps .5 with linespoints title "Fastest Supercomputer (TOP500 #1)" DataThe #1 computer over the years from TOP500, used to generate the supercomputer line at the end of the Gnuplot code. The name of each supercomputer is in the file, but unused in the code/chart. Whole number years represent a June list, .5 represents a November list. Year,Flop/s,Name 1993,59700000000,CM-5/1024 1993.5,124000000000,Numerical Wind Tunnel 1994,143400000000,XP/S140 1994.5,170000000000,Numerical Wind Tunnel 1996,220400000000,SR2201/1024 1996.5,368200000000,CP-PACS/2048 1997,1068000000000,ASCI Red 1997.5,1338000000000,ASCI Red 1999,2121000000000,ASCI Red 1999.5,2379000000000,ASCI Red 2000.5,4938000000000,ASCI White 2001,7226000000000,ASCI White 2002,35860000000000,Earth-Simulator 2004.5,70720000000000,BlueGene/L beta-System 2005,136800000000000,BlueGene/L 2005.5,280600000000000,BlueGene/L 2007.5,478200000000000,BlueGene/L 2008,1026000000000000,Roadrunner 2008.5,1105000000000000,Roadrunner 2009.5,1759000000000000,Jaguar 2010.5,2566000000000000,Tianhe-1A 2011,8162000000000000,K computer 2011.5,10510000000000000,K computer 2012,16324800000000000,Sequoia 2012.5,17590000000000000,Titan 2013,33862700000000000,Tianhe-2A 2016,93014600000000000,Sunway TaihuLight 2018,122300000000000000,Summit 2018.5,143500000000000000,Summit 2020,415530000000000000,Fugaku 2021,442000000000000000,Fugaku 2021.5,1102000000000000000,Frontier 2022,1102000000000000000,Frontier 2022.5,1102000000000000000,Frontier 2023,11940000000000000000,Frontier 2023.5,12060000000000000000,Frontier 2024,17420000000000000000,El Capitan |
Licensing
I, the copyright holder of this work, hereby publish it under the following license:
This file is licensed under the Creative Commons Attribution-Share Alike 3.0 Unported license.
- You are free:
- to share – to copy, distribute and transmit the work
- to remix – to adapt the work
- Under the following conditions:
- attribution – You must give appropriate credit, provide a link to the license, and indicate if changes were made. You may do so in any reasonable manner, but not in any way that suggests the licensor endorses you or your use.
- share alike – If you remix, transform, or build upon the material, you must distribute your contributions under the same or compatible license as the original.
File history
Click on a date/time to view the file as it appeared at that time.
| Date/Time | Thumbnail | Dimensions | User | Comment | |
|---|---|---|---|---|---|
| current | 00:40, 22 February 2023 | | 800 × 600 (49 KB) | Tga.D | updated data, fixed colors and styles to be more color blind-friendly |
| 16:11, 7 March 2022 |  | 800 × 600 (37 KB) | Daemon2010 | Added Fugaku | |
| 06:32, 20 February 2019 |  | 800 × 600 (45 KB) | Tga.D | Increase font size; adjust label positions | |
| 06:15, 20 February 2019 |  | 800 × 600 (45 KB) | Tga.D | Regenerated with a newer version of gnuplot, and more recent TOP500 data. Opted to not update the trendline, as the divergence from expected seems more relevant. | |
| 22:20, 18 June 2013 |  | 800 × 600 (34 KB) | Tga.D | New #1 on the TOP 500 June 2013 list. | |
| 01:07, 24 December 2012 |  | 800 × 600 (34 KB) | Tga.D | large mediawiki-generated png versions had messed up spacing in the key, switching the order to see if it fixes it | |
| 00:29, 24 December 2012 |  | 800 × 600 (34 KB) | Tga.D | User created page with UploadWizard |
File usage
The following 2 pages use this file:
Global file usage
The following other wikis use this file:
- Usage on ar.wikipedia.org
- Usage on bs.wikipedia.org
- Usage on ca.wikipedia.org
- Usage on es.wikipedia.org
- Usage on fa.wikipedia.org
- Usage on fr.wikipedia.org
- Usage on gl.wikipedia.org
- Usage on he.wikipedia.org
- Usage on hu.wikipedia.org
- Usage on id.wikipedia.org
- Usage on ja.wikipedia.org
- Usage on ru.wikipedia.org
- Usage on th.wikipedia.org
- Usage on uk.wikipedia.org
- Usage on vi.wikipedia.org
- Usage on zh.wikipedia.org