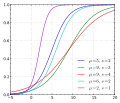
File:Logistic cdf.svg

Original file (SVG file, nominally 450 × 360 pixels, file size: 39 KB)

Summary

Description
English: The cumulative distribution function of a logistic distribution.
Date
Source Own work
Author Krishnavedala
 
W3C-validity not checked.
Source code python:
from numpy import * from matplotlib.pyplot import * from mpl_toolkits.axes_grid.axislines import SubplotZero   e = lambda mu,s,x: exp( (mu-x)/s ) cdf = lambda mu,s,x: 1./ ( 1. + e(mu,s,x) )  fig = figure(figsize=(6,5)) ax = SubplotZero(fig,111) fig.add_subplot(ax)  ax.grid(True) ax.minorticks_on()   x = linspace(-5,20,100) mu = [5,9,9,6,2] s = [2,3,4,2,1] for b in arange(5): 	ax.plot(x,cdf(mu[b],s[b],x),lw=1.5,label=r'$\mu=%d,\, s=%d$'%(mu[b],s[b]))#'$c={}^1\!/_2$')  ax.set_ylim(0,1) ax.set_xlim(-5,20) ax.legend(loc='lower right',frameon=False)  fig.savefig("test.svg",bbox_inches="tight",pad_inches=.15) 

Licensing

Public domain I, the copyright holder of this work, release this work into the public domain. This applies worldwide.
In some countries this may not be legally possible; if so:
I grant anyone the right to use this work for any purpose, without any conditions, unless such conditions are required by law.

Captions

Add a one-line explanation of what this file represents

Items portrayed in this file

depicts

25 September 2011

image/svg+xml

File history

Click on a date/time to view the file as it appeared at that time.

Date/TimeThumbnailDimensionsUserComment
current17:49, 13 October 2021Thumbnail for version as of 17:49, 13 October 2021450 × 360 (39 KB)AkanoToESmoother curves, updated axis labels and font
18:06, 25 September 2011Thumbnail for version as of 18:06, 25 September 2011480 × 409 (88 KB)Krishnavedala

The following page uses this file:

Global file usage

The following other wikis use this file:

Metadata