
 French
 Deutsch
File:Regressions sine demo.svg

Size of this PNG preview of this SVG file: 800 × 400 pixels. Other resolutions: 320 × 160 pixels | 640 × 320 pixels | 1,024 × 512 pixels | 1,280 × 640 pixels | 2,560 × 1,280 pixels | 900 × 450 pixels.
Original file (SVG file, nominally 900 × 450 pixels, file size: 582 KB)
| This is a file from the Wikimedia Commons. Information from its description page there is shown below. Commons is a freely licensed media file repository. You can help. |
Summary
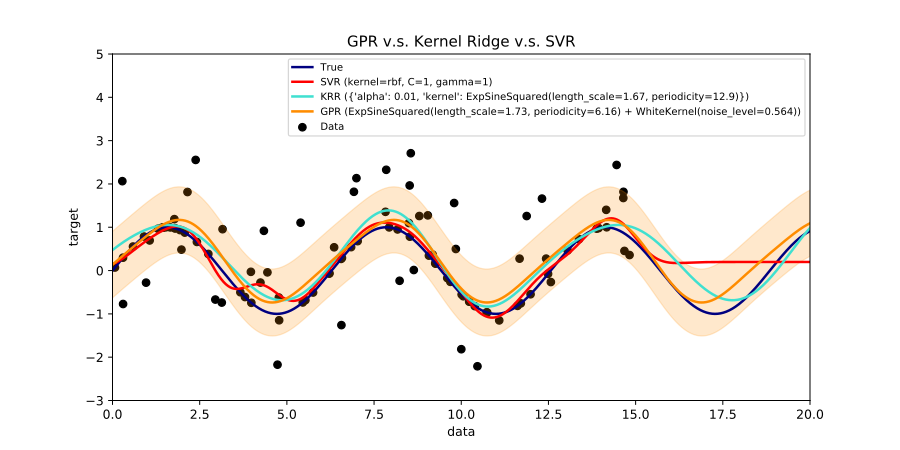
| Description | English: Predictions over a perturbed sine curve with various learning models, e.g., GPR, KRR, SVR. The plot was prepared using scikit-learn. |
| Date | |
| Source | Own work This W3C-unspecified plot was created with Matplotlib. |
| Author | Shiyu Ji |
Python 3 Source Code
# Note: the original version of this demo is in sklearn doc: # http://scikit-learn.org/stable/auto_examples/gaussian_process/plot_compare_gpr_krr.html # http://scikit-learn.org/stable/auto_examples/plot_kernel_ridge_regression.html # Authors: Jan Hendrik Metzen <[email protected]> # License: BSD 3 clause import time import numpy as np import matplotlib matplotlib.use('svg') import matplotlib.pyplot as plt from sklearn.svm import SVR from sklearn.kernel_ridge import KernelRidge from sklearn.model_selection import GridSearchCV from sklearn.gaussian_process import GaussianProcessRegressor from sklearn.gaussian_process.kernels import WhiteKernel, ExpSineSquared rng = np.random.RandomState(0) # Generate sample data X = 15 * rng.rand(100, 1) y = np.sin(X).ravel() y[::2] += rng.normal(scale = 1.0, size = X.shape[0] // 2) # add noise # Fit KernelRidge with param selection param_grid_kr = {"alpha": [1e-1, 1e-2, 1e-3], "kernel": [ExpSineSquared(l, p) for l in np.logspace(-2, 2, 10) for p in np.logspace(0, 2, 10)]} kr = GridSearchCV(KernelRidge(), cv=5, param_grid=param_grid_kr) stime = time.time() kr.fit(X, y) print("Time for KRR fitting: %.3f" % (time.time() - stime)) # Fit GPR gp_kernel = ExpSineSquared(1.0, 5.0, \ periodicity_bounds=(1e-2, 1e1)) \ + WhiteKernel(1e-1) gpr = GaussianProcessRegressor(kernel=gp_kernel) stime = time.time() gpr.fit(X, y) print("Time for GPR fitting: %.3f" % (time.time() - stime)) # Fit SVR svr = SVR(kernel="rbf", C=1, gamma=1) stime = time.time() svr.fit(X, y) print("Time for SVR fitting: %.3f" % (time.time() - stime)) # Predict using kernel ridge X_plot = np.linspace(0, 20, 10000)[:, None] stime = time.time() y_kr = kr.predict(X_plot) print("Time for KRR prediction: %.3f" % (time.time() - stime)) # Predict using Gaussian process stime = time.time() y_gpr = gpr.predict(X_plot, return_std=False) print("Time for GPR prediction: %.3f" % (time.time() - stime)) stime = time.time() y_gpr, y_std = gpr.predict(X_plot, return_std=True) print("Time for GPR prediction with standard-deviation: %.3f" % (time.time() - stime)) # Predict using SVR stime = time.time() y_svr = svr.predict(X_plot) print("Time for SVR prediction: %.3f" % (time.time() - stime)) # Plot results plt.figure(figsize=(10, 5)) lw = 2 plt.scatter(X, y, c='k', label='Data') plt.plot(X_plot, np.sin(X_plot), color='navy', lw=lw, label='True') plt.plot(X_plot, y_svr, color='red', lw=lw, label='SVR (kernel=%s, C=%s, gamma=%s)' % (svr.get_params()['kernel'], svr.get_params()['C'], svr.get_params()['gamma'])) plt.plot(X_plot, y_kr, color='turquoise', lw=lw, label='KRR (%s)' % kr.best_params_) plt.plot(X_plot, y_gpr, color='darkorange', lw=lw, label='GPR (%s)' % gpr.kernel_) plt.fill_between(X_plot[:, 0], y_gpr - y_std, y_gpr + y_std, color='darkorange', alpha=0.2) plt.xlabel('data') plt.ylabel('target') plt.xlim(0, 20) plt.ylim(-3, 5) plt.title('GPR v.s. Kernel Ridge v.s. SVR') plt.legend(loc="best", scatterpoints=1, prop={'size': 8}) plt.savefig('regressions_sine_demo.svg', format='svg') Licensing
I, the copyright holder of this work, hereby publish it under the following license:
This file is licensed under the Creative Commons Attribution-Share Alike 4.0 International license.
- You are free:
- to share – to copy, distribute and transmit the work
- to remix – to adapt the work
- Under the following conditions:
- attribution – You must give appropriate credit, provide a link to the license, and indicate if changes were made. You may do so in any reasonable manner, but not in any way that suggests the licensor endorses you or your use.
- share alike – If you remix, transform, or build upon the material, you must distribute your contributions under the same or compatible license as the original.
File history
Click on a date/time to view the file as it appeared at that time.
| Date/Time | Thumbnail | Dimensions | User | Comment | |
|---|---|---|---|---|---|
| current | 19:57, 3 July 2017 | | 900 × 450 (582 KB) | Shiyu Ji | User created page with UploadWizard |
File usage
The following 4 pages use this file:
Global file usage
The following other wikis use this file:
- Usage on kaa.wikipedia.org
- Usage on ru.wikipedia.org
- Usage on uk.wikipedia.org
- Usage on zh.wikipedia.org