
 French
 Deutsch
File:Voltage regulator foldback.svg

Size of this PNG preview of this SVG file: 278 × 276 pixels. Other resolutions: 242 × 240 pixels | 483 × 480 pixels | 774 × 768 pixels | 1,031 × 1,024 pixels | 2,063 × 2,048 pixels.
Original file (SVG file, nominally 278 × 276 pixels, file size: 45 KB)
| This is a file from the Wikimedia Commons. Information from its description page there is shown below. Commons is a freely licensed media file repository. You can help. |
Summary
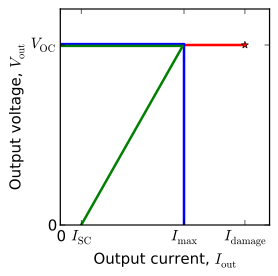
| Description | English: Voltage regulator V-I curves for foldback, current limited, and unlimited. |
| Date | |
| Source | Own work |
| Author | Nanite |
| SVG development | This W3C-invalid plot was created with Matplotlib. |
| Source code | Python code#Requires [[:wikipedia:matplotlib|matplotlib]]. Due to a bug in wikipedia's SVG renderer, #the raw files appear with curves peeking outside of the axes. #Before uploading the files were touched up by releasing and re-setting the clip paths. from pylab import * figtype = '.svg' saveopts = {'bbox_inches':'tight'} #, 'transparent':True, 'frameon':True} seterr(divide='ignore') V_fb = concatenate([linspace(9.95,9.95,100, endpoint=False), linspace(9.95,0,101)]) I_fb = concatenate([linspace(0,0.995,100, endpoint=False), linspace(0.995,0.17,101)]) V_cl = concatenate([linspace(10.05,10.05,100, endpoint=False), linspace(10.05,0,101)]) I_cl = concatenate([linspace(0,1.005,100, endpoint=False), linspace(1.005,1.005,101)]) V_nl = linspace(10,10,151) I_nl = linspace(0,1.5,151) # Compute powers; Assume regulator is dropping voltage from a source 20% higher than V_oc. P_cl = I_cl*(V_cl[0]*1.2 - V_cl) P_fb = I_fb*(V_fb[0]*1.2 - V_fb) P_nl = I_nl*(V_nl[0]*1.2 - V_nl) Gcrit = 0.1 Rcrit = 10 Pcrit = 2 ### Make V-I curve plot fig = figure() ax = axes() xlim(0,1.7) ylim(0,12) ax.set_xlabel('Output current, $I_{\\rm out}$') ax.set_xticks([I_fb[0], I_fb[-1], max(I_cl), max(I_nl)]) ax.set_xticklabels(['0', '$I_{\\rm SC}$', '$I_{\\rm max}$', '$I_{\\rm damage}$']) ax.set_ylabel('Output voltage, $V_{\\rm out}$') ax.set_yticks([0,10]) ax.set_yticklabels(['0', '$V_{\\rm OC}$']) ax.plot(I_nl, V_nl, 'r', linewidth=2) ax.plot([I_nl[-1]], [V_nl[-1]], 'r*', linewidth=2) ax.plot(I_cl, V_cl, 'b', linewidth=2) ax.plot(I_fb, V_fb, 'g', linewidth=2) fig.set_size_inches(3,3) fig.patch.set_alpha(0) savefig('foldback-vi'+figtype, **saveopts) ### Make power and resistance load plot fig = figure() ax = axes() xlim(0,0.5) ylim(0,13) ax.set_xlabel('Load conductance ($\Omega^{-1}$)') #ax.set_xticks([0,0.1]) #ax.set_xticklabels(['0', '$G_{\\rm crit}$']) ax.set_ylabel('Regulator heating power (W)') ax.set_yticks([0, round(P_fb[100],1), round(max(P_fb),1), round(P_fb[-1],1), round(P_cl[-1],1)]) #ax.set_yticklabels(['0', '$P_{\\rm max,FB}$', '$P_{\\rm SC,FB}$','$P_{\\rm SC,CL}$']) # Plot heat in regulator vs. conductance ax.axvline(Gcrit, color='#777777', linestyle='dashed', linewidth=0.5) ax.axhline(P_fb[-1], color='#777777', linestyle='dashed', linewidth=0.5) ax.axhline(P_cl[-1], color='#777777', linestyle='dashed', linewidth=0.5) ax.plot(I_nl/V_nl, P_nl, 'r', linewidth=2) ax.plot([(I_nl/V_nl)[-1]], [P_nl[-1]], 'r*', linewidth=2) ax.plot(I_cl/V_cl, P_cl, 'b', linewidth=2) ax.plot(I_fb/V_fb, P_fb, 'g', linewidth=2) ax.text(Gcrit/2, 9, 'OK', horizontalalignment='center') ax.text(0.3, 9, 'Overload', horizontalalignment='center') fig.set_size_inches(3,3) fig.patch.set_alpha(0) savefig('foldback-loadcon'+figtype, **saveopts) ### Make power and conductance load plot fig = figure() ax = axes() xlim(0,16) ylim(0,13) ax.set_xlabel('Load resistance ($\Omega$)') ax.set_xticks([0,5,10,15]) #ax.set_xticklabels(['0', '$G_{\\rm crit}$']) ax.set_ylabel('Dissipation in regulator (W)') #ax.set_yticks([0, # round(P_fb[100],1), # round(max(P_fb),1), # round(P_fb[-1],1), # round(P_cl[-1],1)]) #ax.set_yticklabels(['0', '$P_{\\rm max,FB}$', '$P_{\\rm SC,FB}$','$P_{\\rm SC,CL}$']) # Plot heat in regulator vs. resistance amfb = argmax(P_fb) # grey lines ax.axvline(Rcrit, color='#777777', linestyle='dashed', linewidth=0.5) ax.plot([0,V_fb[amfb]/I_fb[amfb]], [P_fb[amfb]]*2, color='#777777', linestyle='dashed', linewidth=0.5) ax.plot([0,Rcrit],[Pcrit,Pcrit], color='#777777', linestyle='dashed', linewidth=0.5) #curves ax.plot(V_nl/I_nl, P_nl, 'r', linewidth=2) ax.plot([(V_nl/I_nl)[-1]], [P_nl[-1]], 'r*', linewidth=2) ax.plot(V_cl/I_cl, P_cl, 'b', linewidth=2) ax.plot(V_fb/I_fb, P_fb, 'g', linewidth=2) ax.text(Rcrit/2, 12, 'Overloaded', horizontalalignment='center') ax.text(13, 12, 'Normal', horizontalalignment='center') fig.set_size_inches(3,3) fig.patch.set_alpha(0) savefig('foldback-loadres'+figtype, **saveopts) |
Licensing
I, the copyright holder of this work, hereby publish it under the following license:
| This file is made available under the Creative Commons CC0 1.0 Universal Public Domain Dedication. | |
| The person who associated a work with this deed has dedicated the work to the public domain by waiving all of their rights to the work worldwide under copyright law, including all related and neighboring rights, to the extent allowed by law. You can copy, modify, distribute and perform the work, even for commercial purposes, all without asking permission.
|
File history
Click on a date/time to view the file as it appeared at that time.
| Date/Time | Thumbnail | Dimensions | User | Comment | |
|---|---|---|---|---|---|
| current | 06:41, 2 August 2013 | | 278 × 276 (45 KB) | Nanite | labels, transparency |
| 14:17, 1 August 2013 |  | 278 × 274 (25 KB) | Nanite | User created page with UploadWizard |
File usage
The following 2 pages use this file:
Global file usage
The following other wikis use this file:
- Usage on ca.wikipedia.org
- Usage on fa.wikipedia.org
- Usage on it.wikibooks.org
- Usage on zh.wikipedia.org