
 French
 Deutsch
Valley County, Montana
Valley County | |
|---|---|
 Valley County Courthouse in Glasgow | |
 Location within the U.S. state of Montana | |
 Montana's location within the U.S. | |
| Coordinates: 48°22′N 106°40′W / 48.36°N 106.66°W | |
| Country | |
| State | |
| Founded | 1893 |
| Seat | Glasgow |
| Largest city | Glasgow |
| Area | |
| • Total | 5,062 sq mi (13,110 km2) |
| • Land | 4,926 sq mi (12,760 km2) |
| • Water | 136 sq mi (350 km2) 2.7% |
| Population (2020) | |
| • Total | 7,578 |
| • Estimate (2022) | 7,513 |
| • Density | 1.5/sq mi (0.58/km2) |
| Time zone | UTC−7 (Mountain) |
| • Summer (DST) | UTC−6 (MDT) |
| Congressional district | 2nd |
| Website | valleycountymt |
| |
Valley County is a county in the U.S. state of Montana. Valley County was created in 1893 with area partitioned from Dawson County.[1] As of the 2020 census, the population was 7,578.[2] Its county seat is Glasgow.[3] It is located on the Canada–United States border with Saskatchewan.
Geography[edit]
According to the United States Census Bureau, the county has a total area of 5,062 square miles (13,110 km2), of which 4,926 square miles (12,760 km2) is land and 136 square miles (350 km2) (2.7%) is water.[4] It is Montana's fourth-largest county by total area.
Transportation[edit]
Major highways[edit]
 U.S. Highway 2
 Montana Highway 24
 Montana Highway 42
 Montana Highway 117
 Montana Secondary Highway 248
Bus[edit]
Glasgow and the greater Valley County region are served by a non-profit taxi/bus service called Valley Country Transit.[5]
Rail[edit]
Adjacent counties and rural municipalities[edit]
- Phillips County - west
- Garfield County - south
- McCone County - south
- Roosevelt County - east
- Daniels County - east
- Rural Municipality (RM) of Mankota No. 45, Saskatchewan (SK) - north
- RM of Waverley No. 44, SK - north
- RM of Old Post No. 43, SK - north
National protected area[edit]
Economy[edit]
Agriculture is the major economic activity of Valley County. The US Air Force operated Glasgow Air Force Base at St. Marie until 1976, which was a strong influence on the local economy until its closure.
Demographics[edit]
| Census | Pop. | Note | %± |
|---|---|---|---|
| 1900 | 4,355 | — | |
| 1910 | 13,630 | 213.0% | |
| 1920 | 11,542 | −15.3% | |
| 1930 | 11,181 | −3.1% | |
| 1940 | 15,181 | 35.8% | |
| 1950 | 11,353 | −25.2% | |
| 1960 | 17,080 | 50.4% | |
| 1970 | 11,471 | −32.8% | |
| 1980 | 10,250 | −10.6% | |
| 1990 | 8,239 | −19.6% | |
| 2000 | 7,675 | −6.8% | |
| 2010 | 7,369 | −4.0% | |
| 2020 | 7,578 | 2.8% | |
| 2022 (est.) | 7,513 | [6] | −0.9% |
| U.S. Decennial Census[7] 1790–1960,[8] 1900–1990,[9] 1990–2000,[10] 2010–2020[2] | |||
2020 census[edit]
As of the 2020 census, there were 7,578 people living in the county.[citation needed]
2010 census[edit]
As of the 2010 census, there were 7,369 people, 3,198 households, and 1,997 families living in the county. The population density was 1.5 inhabitants per square mile (0.58/km2). There were 4,879 housing units at an average density of 1.0 units per square mile (0.39/km2). The racial makeup of the county was 87.0% white, 9.8% American Indian, 0.5% Asian, 0.2% black or African American, 0.3% from other races, and 2.1% from two or more races. Those of Hispanic or Latino origin made up 1.2% of the population. In terms of ancestry, 33.4% were German, 27.9% were Norwegian, 12.4% were Irish, 10.3% were English, and 6.8% were American.
Of the 3,198 households, 26.9% had children under the age of 18 living with them, 50.3% were married couples living together, 8.0% had a female householder with no husband present, 37.6% were non-families, and 33.4% of all households were made up of individuals. The average household size was 2.26 and the average family size was 2.88. The median age was 46.4 years.
The median income for a household in the county was $42,050 and the median income for a family was $54,096. Males had a median income of $40,802 versus $30,272 for females. The per capita income for the county was $24,305. About 5.7% of families and 10.1% of the population were below the poverty line, including 17.0% of those under age 18 and 11.8% of those age 65 or over.
Politics[edit]
Valley County voters vote reliably Republican in national elections. Since 1964, they have selected the Democratic Party candidate only once (1992, due to strong showing by third-party candidate Ross Perot, which split the Republican voters).
| Year | Republican | Democratic | Third party | |||
|---|---|---|---|---|---|---|
| No. | % | No. | % | No. | % | |
| 2020 | 3,135 | 73.57% | 1,030 | 24.17% | 96 | 2.25% |
| 2016 | 2,698 | 69.29% | 886 | 22.75% | 310 | 7.96% |
| 2012 | 2,337 | 60.56% | 1,385 | 35.89% | 137 | 3.55% |
| 2008 | 2,121 | 54.23% | 1,645 | 42.06% | 145 | 3.71% |
| 2004 | 2,476 | 61.62% | 1,431 | 35.61% | 111 | 2.76% |
| 2000 | 2,500 | 63.08% | 1,273 | 32.12% | 190 | 4.79% |
| 1996 | 1,838 | 43.69% | 1,674 | 39.79% | 695 | 16.52% |
| 1992 | 1,497 | 32.77% | 1,715 | 37.54% | 1,356 | 29.68% |
| 1988 | 2,467 | 52.42% | 2,163 | 45.96% | 76 | 1.61% |
| 1984 | 3,123 | 61.89% | 1,849 | 36.64% | 74 | 1.47% |
| 1980 | 3,242 | 62.47% | 1,567 | 30.19% | 381 | 7.34% |
| 1976 | 2,520 | 50.82% | 2,352 | 47.43% | 87 | 1.75% |
| 1972 | 3,210 | 60.02% | 1,973 | 36.89% | 165 | 3.09% |
| 1968 | 2,290 | 49.44% | 1,926 | 41.58% | 416 | 8.98% |
| 1964 | 2,077 | 40.53% | 3,032 | 59.16% | 16 | 0.31% |
| 1960 | 2,387 | 44.65% | 2,953 | 55.24% | 6 | 0.11% |
| 1956 | 2,357 | 48.42% | 2,511 | 51.58% | 0 | 0.00% |
| 1952 | 2,462 | 53.28% | 2,130 | 46.09% | 29 | 0.63% |
| 1948 | 1,375 | 33.45% | 2,535 | 61.68% | 200 | 4.87% |
| 1944 | 1,341 | 37.44% | 2,196 | 61.31% | 45 | 1.26% |
| 1940 | 1,597 | 30.94% | 3,493 | 67.67% | 72 | 1.39% |
| 1936 | 996 | 14.11% | 5,862 | 83.07% | 199 | 2.82% |
| 1932 | 1,242 | 30.35% | 2,499 | 61.07% | 351 | 8.58% |
| 1928 | 2,330 | 63.85% | 1,294 | 35.46% | 25 | 0.69% |
| 1924 | 1,555 | 51.10% | 497 | 16.33% | 991 | 32.57% |
| 1920 | 2,096 | 62.89% | 895 | 26.85% | 342 | 10.26% |
| 1916 | 1,111 | 32.28% | 2,102 | 61.07% | 229 | 6.65% |
| 1912 | 668 | 25.84% | 696 | 26.92% | 1,221 | 47.23% |
| 1908 | 843 | 59.12% | 503 | 35.27% | 80 | 5.61% |
| 1904 | 742 | 67.70% | 335 | 30.57% | 19 | 1.73% |
Communities[edit]
City[edit]
- Glasgow (county seat)
Towns[edit]
Census-designated places[edit]
Unincorporated communities[edit]
Ghost towns[edit]
Census Maps[edit]
 |  |
See also[edit]
- Fort Peck Dam
- List of lakes in Valley County, Montana (A-L)
- List of lakes in Valley County, Montana (M-Z)
- List of mountains in Valley County, Montana
- National Register of Historic Places listings in Valley County, Montana
References[edit]
- ^ Stout, Tom (1921). Montana, its story and biography; a history of aboriginal and territorial Montana and three decades of statehood, under the editorial supervision of Tom Stout. Chicago IL: American Historical Society. Retrieved December 7, 2013.
- ^ a b "State & County QuickFacts". United States Census Bureau. Retrieved May 8, 2023.
- ^ "Find a County". National Association of Counties. Retrieved June 7, 2011.
- ^ "2010 Census Gazetteer Files". United States Census Bureau. August 22, 2012. Archived from the original on December 5, 2014. Retrieved November 30, 2014.
- ^ "Valley County Transit". Glasgow, Montana: Valley County Transit. Retrieved March 4, 2023.
- ^ "Annual Estimates of the Resident Population for Counties: April 1, 2020 to July 1, 2022". United States Census Bureau. Retrieved May 8, 2023.
- ^ "U.S. Decennial Census". United States Census Bureau. Retrieved November 30, 2014.
- ^ "Historical Census Browser". University of Virginia Library. Retrieved November 30, 2014.
- ^ "Population of Counties by Decennial Census: 1900 to 1990". United States Census Bureau. Retrieved November 30, 2014.
- ^ "Census 2000 PHC-T-4. Ranking Tables for Counties: 1990 and 2000" (PDF). United States Census Bureau. Archived (PDF) from the original on March 27, 2010. Retrieved November 30, 2014.
- ^ Leip, David. "Atlas of US Presidential Elections". uselectionatlas.org. Retrieved April 3, 2018.
- ^ Baylor MT Google Maps (accessed January 7, 2019)
- ^ Miles Crossing MT Google Maps (accessed January 7, 2019)
- ^ Park Grove MT Google Maps (accessed January 7, 2019)
- ^ Richland Post Office MT Google Maps (accessed January 7, 2019)
- ^ Roanwood MT Google Maps (accessed January 7, 2019)
- ^ Tampico MT Google Maps (accessed January 7, 2019)
- ^ Whately MT Google Maps (accessed January 7, 2019)
- ^ Wheeler MT Google Maps (accessed January 7, 2019)
- ^ Beaverton MT Google Maps (accessed January 7, 2019)
- ^ Thoeny MT Google Maps (accessed January 7, 2019)
External links[edit]
Places adjacent to Valley County, Montana | ||||||||||||||||
|---|---|---|---|---|---|---|---|---|---|---|---|---|---|---|---|---|
| ||||||||||||||||
Municipalities and communities of Valley County, Montana, United States | ||
|---|---|---|
| City | 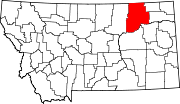 | |
| Towns | ||
| CDPs | ||
| Other communities | ||
| Indian reservations | ||
| Ghost towns | ||
| Footnotes | ‡This populated place also has portions in an adjacent county or counties | |
| International | |
|---|---|
| National | |